@benjamincowen
“@benjamincowen holds a 48.6% all-time accuracy across 61 calls, focusing primarily on BTC and ETH with a balanced long/short bias and a slight edge in long-term and mid-term calls. His YTD accuracy of 55.7% suggests improving form, with his strongest pattern in break/pump setups where he has built a consistent body of conditional calls.”
Score Breakdown
| CallRank Score | Move · Path · Time | Scored | |
|---|---|---|---|
| ALL-TIME | 51% | 0.66 · 0.51 · 0.50 | 68 |
| YTD | 58% | 0.72 · 0.58 · 0.61 | 30 |
| 30D | — | — | 0 |
CallRank Score by Duration
Short term35% 6 calls
Medium term52% 29 calls
Long term54% 33 calls
CallRank Score · Last 12 Months
Asset Breakdown — Top 5
| Asset | CallRank Score | Calls | 🟢 Bull · 🔴 Bear |
|---|---|---|---|
| BTC | 54% | 45 | 15 · 30 |
| ETH | 47% | 23 | 17 · 6 |
Live Calls Summary · By Horizon
@benjamincowen's active forecasts grouped by horizon and asset. L = Long, S = Short, number = open call count.
Active assets for this forecaster:
| No assets selected | |
|---|---|
| ST | — |
| MT | — |
| LT | — |
ST = Short term · MT = Medium term · LT = Long term
Active Calls · 9 Live
BE
𝕏
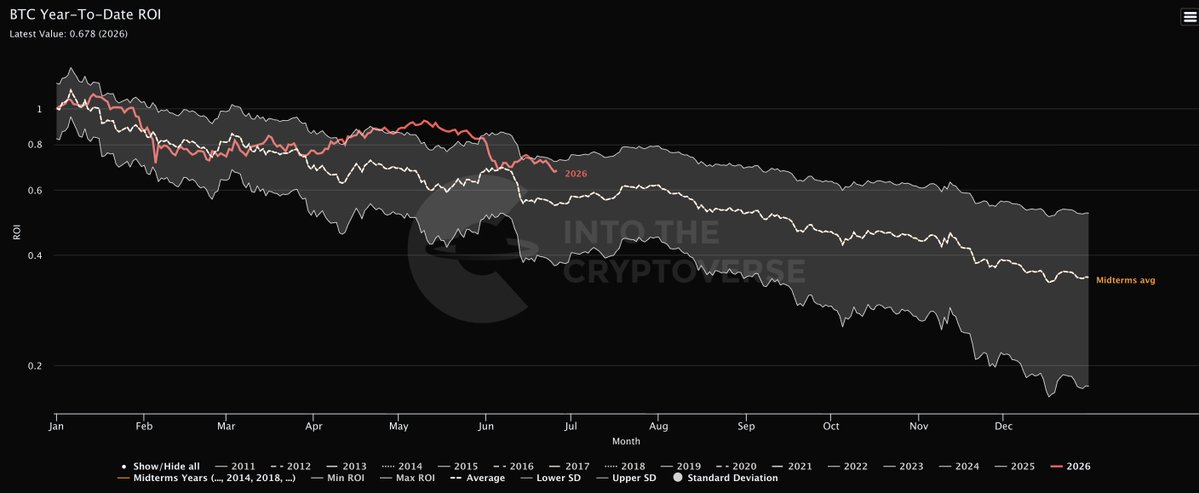
While this bear market feels different, Bitcoin is still tracking the average of prior midterm-year bear markets.
Structurally, the market typically gets one final countertrend rally sometime in the summer before the final low occurs later in the year. https://t.co/ybrCMHz9Wr
Max Favorable +5.0%Max Adverse −4.3%ACTIVE
BE
𝕏
While I think BTC bottoms in Q4 2026, the time to start accumulating BTC is often after the drop into the summer.
I basically just ignore Bitcoin for the first half of midterm years, then look for deals in the second half.
You do not have to time bottoms exactly to make money
Max Favorable +20.9%Max Adverse −1.9%ACTIVE
BE
𝕏
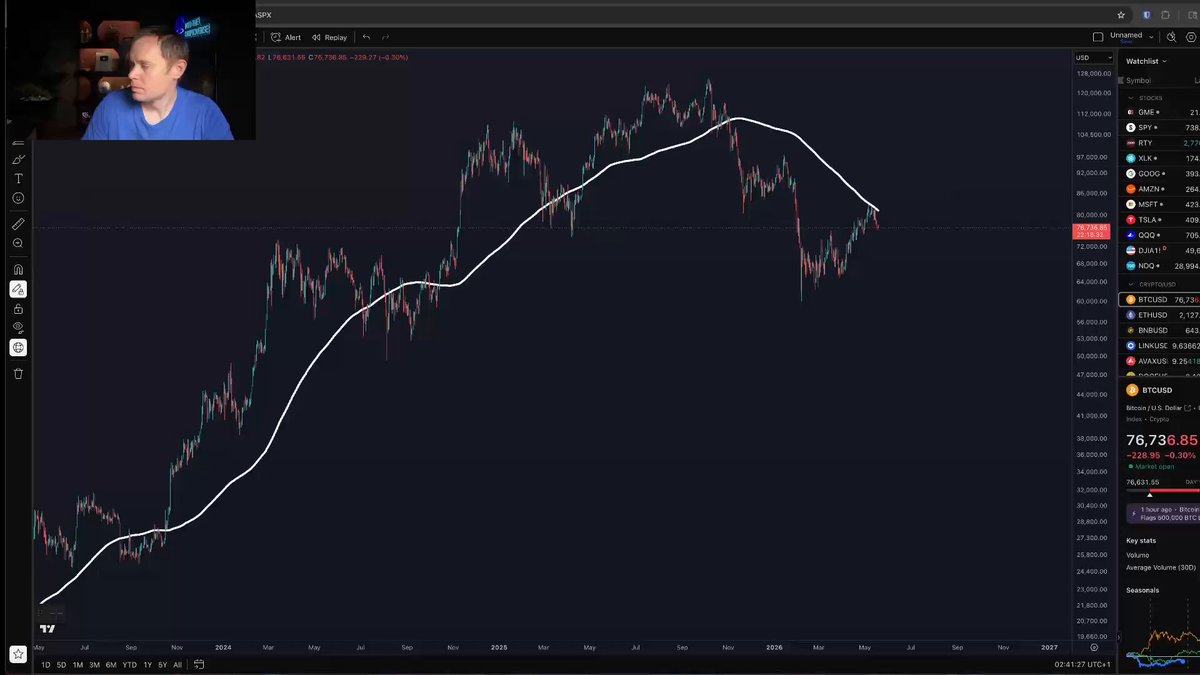
Bitcoin Rejected off its 200D.
In this video we talk about a couple of paths over the next few months.
I still think BTC goes lower into Q4, but the path to get there is hard to nail down. https://t.co/dowBj9t5LX
Max Favorable +24.8%Max Adverse −1.8%ACTIVE
BE
𝕏
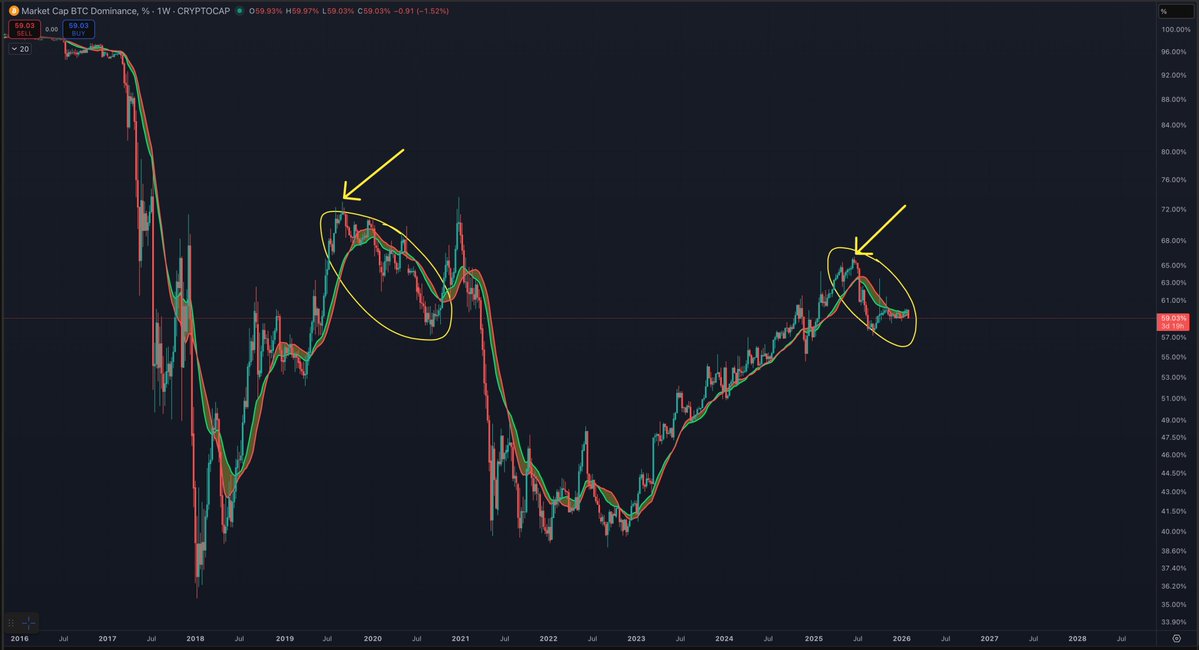
In 2019 when BTC dominance dropped, it dropped because BTC was dropping faster than alts.
Why?
Because by the time the bear market started, altcoins had already been annihilated.
Once BTC broke out of the bear market, BTC dominance went back up to the highs.
So I think it feels similar now.
BTC is post-top and after QT ended.
BTC goes down and drags the rest of the market with it.
Good chance this process ends later this year, so stay tuned!
Max Favorable +18.7%Max Adverse −16.6%ACTIVE
BE
𝕏
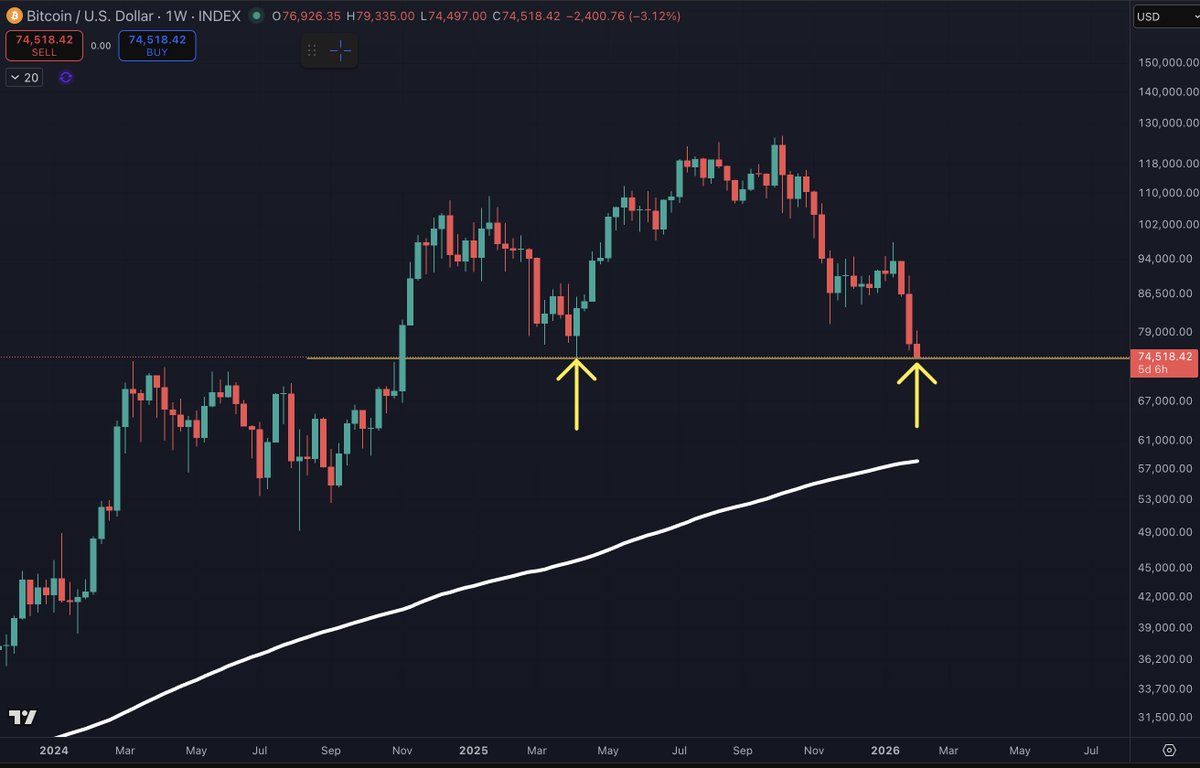
If BTC follows prior midterm years, it goes straight to the 200W SMA.
If BTC follows 2019, it bounces, then goes to 200W SMA in a few months.
Either way, BTC likely ends up at the 200W SMA this year
The path to get there is challenging, since BTC topped on apathy, not euphoria https://t.co/Cmmq9ZJSWP
Max Favorable +22.0%Max Adverse −11.8%ACTIVE
Scored Calls · Full Audit Trail
BE
𝕏
Simulation confirmed https://t.co/m3zSDJyXpa

Max Favorable +1.2%Max Adverse −5.2%Opportunity 0.59Time 0.50Magnitude 0.59Score 0.33
BE
𝕏
Plausible path:
Bitcoin forms a low in June (like it did in June 2018 and June 2022).
BTC rallies in July
SPX correction later in year which allows Bitcoin to finally bottom (most likely October)
Four year cycle wins again
Max Favorable +14.1%Max Adverse −0.9%Opportunity 0.80Time 1.00Magnitude 0.80Score 0.83
BE
𝕏
Trying to predict short-term price action is hard, as I generally consider the short-term moves akin to a random walk, or geometric brownian motion.
..but..
if i had to guess, I would guess that BTC tags $70k soon, then gets a small bounce.
But after the bounce is over (likely a few days to a week or so), I do think BTC will head back to the lows from February 2026.
If I'm wrong about BTC revisiting the lows from February, I will quote tweet this and simply say "I was wrong."
And then I will let every bull dunk away.
Max Favorable +0.1%Max Adverse −15.7%Opportunity 0.17Time 0.00Magnitude 0.17Score 0.05
BE
𝕏
Trying to predict short-term price action is hard, as I generally consider the short-term moves akin to a random walk, or geometric brownian motion.
..but..
if i had to guess, I would guess that BTC tags $70k soon, then gets a small bounce.
But after the bounce is over (likely a few days to a week or so), I do think BTC will head back to the lows from February 2026.
If I'm wrong about BTC revisiting the lows from February, I will quote tweet this and simply say "I was wrong."
And then I will let every bull dunk away.
Max Favorable +21.4%Max Adverse −0.0%Opportunity 0.91Time 1.00Magnitude 0.91Score 0.92
BE
𝕏
Bitcoin Weakness Window https://t.co/l6cIUrTJRW

Max Favorable +21.0%Max Adverse −1.2%Opportunity 0.92Time 0.94Magnitude 0.92Score 0.89