@drprofitcrypto
“@drprofitcrypto maintains 58.1% accuracy across 346 calls, focusing on BTC, ETH, and select alts with a balanced long/short bias and strongest results on long-term horizons (60.5%). Their edge lies in Wick/Liquidity grab setups, with 75 calls of that type making it a clear specialization that drives consistency across timeframes.”
Score Breakdown
| CallRank Score | Move · Path · Time | Scored | |
|---|---|---|---|
| ALL-TIME | 58% | 0.69 · 0.59 · 0.58 | 359 |
| YTD | 60% | 0.70 · 0.63 · 0.61 | 97 |
| 30D | — | — | 0 |
CallRank Score by Duration
Short term55% 59 calls
Medium term58% 211 calls
Long term60% 89 calls
CallRank Score · Last 12 Months
Asset Breakdown — Top 5
| Asset | CallRank Score | Calls | 🟢 Bull · 🔴 Bear |
|---|---|---|---|
| BTC | 59% | 314 | 133 · 181 |
| ETH | 52% | 31 | 27 · 4 |
| XRP | 38% | 9 | 8 · 1 |
| HYPE | 77% | 1 | 1 · 0 |
| TRUMP | 73% | 1 | 1 · 0 |
Live Calls Summary · By Horizon
@drprofitcrypto's active forecasts grouped by horizon and asset. L = Long, S = Short, number = open call count.
Active assets for this forecaster:
| No assets selected | |
|---|---|
| ST | — |
| MT | — |
| LT | — |
ST = Short term · MT = Medium term · LT = Long term
Active Calls · 36 Live
DR
𝕏
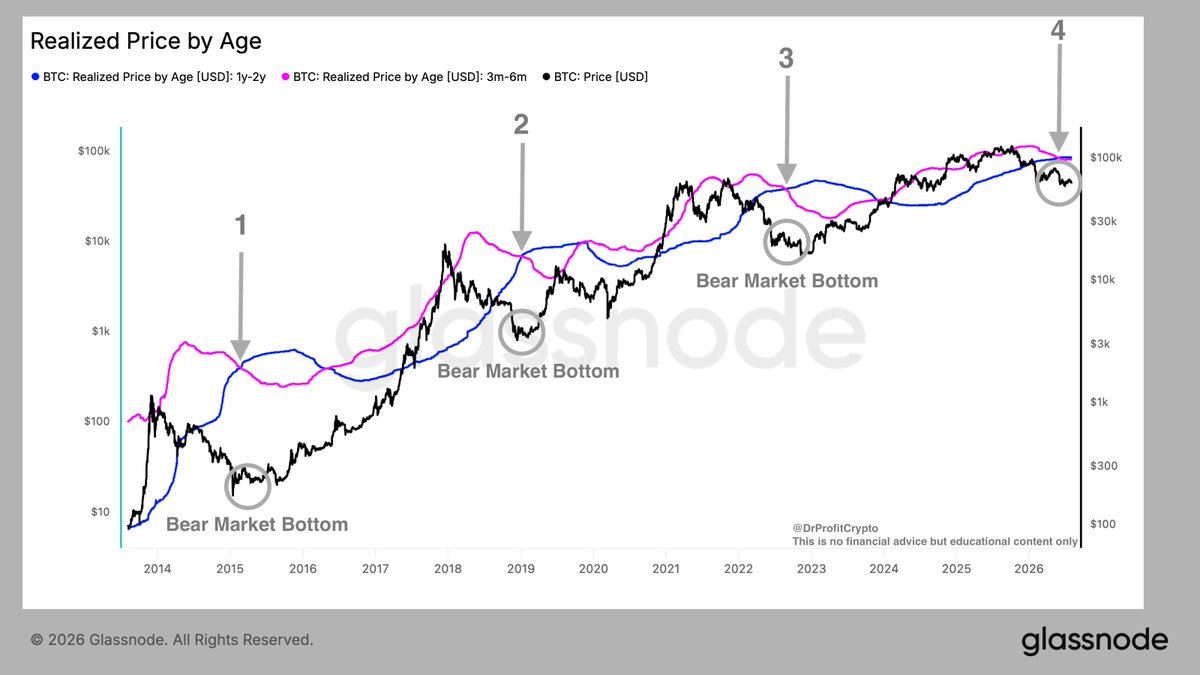
$BTC: Historic Indicator flashing bottom was in or is very close
Realized Price by Age shows the average price at which different groups of Bitcoin last moved on-chain, giving us an estimate of their cost basis. The pink line represents Bitcoin held for 3–6 months, while the blue line represents BTC held for 1–2 years.
In 2015, 2019 and 2022, the bottom-formation phase began when the pink line crossed below the blue line. This shows that newer buyers capitulated, sold at a loss and transferred their Bitcoin into stronger, longer-term hands. We are now seeing this crossover for the fourth time, while Bitcoin is trading below both groups’ average cost basis. Historically, however, this did not produce an immediate reversal, as Bitcoin continued moving sideways for months while the market formed its base which can be translated into an accumulation zone, what I spoke about in the last Sunday Reports. This is exactly what I believe we are witnessing now: a bear-market bottom formation and long-term accumulation phase. I am buying step by step between 54-64k since weeks already, and I am sharing each of my buy orders in 5% steps in real time in the premium membership only. Join now: https://t.co/Qx4dZU3sVM
This is Educational content, not financial advice.
ACTIVE
DR
𝕏
$BTC:
I never shorted the exact $125k top. I shorted throughout the $115k–$125k range, sold all my Bitcoin and went into a big short position by calling it the end of the bull market. Don’t say that my 115-125k short was perfectly entered at 125k when it’s simply not true. My entry was in the 115-125k range, not the perfect 125k as some people mention!
Today, my accumulation range is $64k–$54k, and I’m buying accordingly. I won’t be able to predict the EXACT bottom, and everyone who claims he can is a liar. I’m good at predicting regions, and I appreciate your respect for that! My buying region indicates that this is the bottom region, and I’m preparing for that.
PENDING TRIGGER
DR
𝕏
Next to the Clarity act, there is nothing more important than the alliance of BlackRock, CoinBase, Circle and ETH. My biggest bets of this cycle are on $ETH, $CIRCLE and $COIN. The reasons are in the ‘Galactic Three’ report I have shared few days ago. It’s coming!
Max Favorable +0.7%Max Adverse −0.5%ACTIVE
DR
𝕏
#Bitcoin – What's Next?
The Big Sunday Report: All We Need to Know
🚩 TA / LCA / Psychological Breakdown: Let's have a look at the chart together and see where the market stands, what the market expects, and what might happen next. And as always, the golden rule applies: the mass is wrong. For now we can fairly agree that we have three camps of people. Most people are saying that BTC will bottom between 40-50k in September-October. The second camp are the people that say the bottom was already in, and the third camp are the people that say the bottom will be between 28-33k. The largest supported opinion is the one that the bottom will be 40-50k, and thats what the mass is thinking. And here is the important part: I called 40-50k back at 120k at the top in October 2025, when nobody wanted to hear it and everyone was calling for new ATHs. The mass laughed at those targets back then, and now the same mass has adopted them as their own. I just recently changed my final target: instead of 40-50k, I now consider the current range down to 54k as the very interesting zone, and since my announcement I am buying BTC and ETH with 5% batches inside my 54-64k range. And here is the point everyone needs to understand: when the entire market agrees on the same bottom target in the same month, that target loses its power. The bottom the mass is waiting for is the bottom the market will not deliver in the way they expect. They are trading my old call. I have already moved on. And to give the best example: They are now believing in the four years cycle, but called it a disgrace at the top of 120k, so if they believe in the four years cycle, why did they not believe when the market hit 120k at the exact four years cycle peak, why are they cherry picking their cycle lows , and the answer can be found in their greed.
We Are Still in a Bear Market, and That Is Exactly Why I Am Buying. Bitcoin is not in a bull market. Bitcoin is in a bear market, and this is exactly the reason why I am buying. It is understandable that a fool sees only two states: bull market or bear market. It's the same fool who rushes into an intersection the moment the traffic light turns yellow, without looking left or right, simply because it was red a second ago and assumes green must come next. Only a fool enters an intersection on yellow without understanding what comes next. Markets work exactly the same way. They are not simply "bull" or "bear," especially during major tops and bottoms. The transition is where the biggest opportunities are created, yet it is also where the majority becomes the most confused.
When I say I anticipate the end of the bear market, that does not mean we are already in a bull market. It means I am accumulating during the bear market because I believe its final phase is approaching. That is exactly where the highest risk-adjusted returns have always been made. The greatest investments are made in bear markets, not after everyone agrees a bull market has already begun. So let me make this perfectly clear: we are still in a bear market. I have never claimed otherwise. The difference is that I am buying before the crowd recognizes the transition. Those who can only think in black and white fail to understand that accumulation happens before confirmation. By the time the market officially becomes a bull market in the eyes of the public, the biggest opportunity has already passed. I am actively accumulating Bitcoin, and my purchases are shared in real time in Premium. Every single purchase, every single DCA I do, is shared in real time in Premium, and for that reason I am not able to disclose my exact entries publicly. But the accumulation has started, and I am looking forward to accumulating more of BTC, ETH, and some altcoins that will be shared in Premium only. Join Premium here: https://t.co/iKJBbnCfrg
The MA200 Weekly: History Keeps Proving the Point
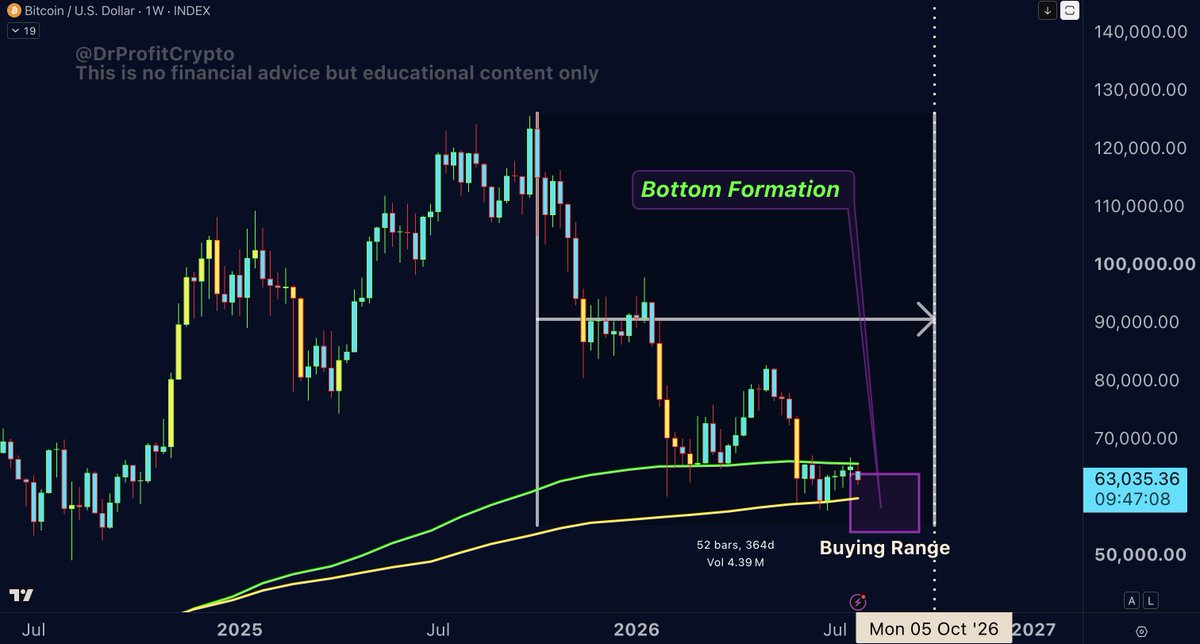
Bitcoin has lost its MA200 weekly once again on the weekly time frame, and that is not an issue at all. We all know that in history Bitcoin lost the MA200 weekly several times. In fact, every single time BTC traded below the MA200 weekly, it was a great buying opportunity, and history is proving my words. Look at the chart: the Buying Range sits exactly where price is trading right now, directly at and below the MA200 weekly, with the bottom formation building in front of us. This is not the zone where you panic. This is the zone where my positions are built.
Saylor Wants to Sell Where I Am Buying
And now to the most interesting news of the week. Saylor is now considering selling $5 billion worth of Bitcoin, at a price point where I started my recent accumulation. Read that again. The man who said he would never sell, who laughed at every of my warnings, who kept buying at 100k, 110k, 120k with leverage on top, is now considering selling $5 billion at the bottom of the cycle, in the exact zone where I am slowly and carefully buying since days. I warned about Saylor publicly at the top. I told him to take profits at 115-125k. He refused, he mocked the idea of ever selling, and now his structure is forcing his hand at 60k instead of 120k. This is what happens when you have no plan: the market makes the plan for you, and the market's plan is always worse than the one you refused to make yourself. If Saylor's $5 billion hits the market inside my zone, I welcome it. Forced selling from a trapped whale is exactly the kind of liquidity event that marks accumulation zones. I am planning to buy anything between 54-64k as announced, and if Saylor's supply gives us deeper prices inside that range, my average entry only gets better.
The Setup Going Into October
The chart marks the path: bottom formation building through the coming weeks, the Buying Range between 54-64k active. This aligns with everything I have laid out since the pivot. The mass waits for 40-50k in September-October. I accumulate 54-64k now.
Join Premium here: https://t.co/iKJBbnCfrg
THIS IS NO FINANCIAL ADVICE BUT EDUCATIONAL CONTENT ONLY.
Max Favorable +0.2%Max Adverse −2.3%ACTIVE
DR
𝕏
#Bitcoin – What's Next?
The Big Sunday Report: All We Need to Know
🚩 TA / LCA / Psychological Breakdown: Let's have a look at the chart together and see where the market stands, what the market expects, and what might happen next. And as always, the golden rule applies: the mass is wrong. For now we can fairly agree that we have three camps of people. Most people are saying that BTC will bottom between 40-50k in September-October. The second camp are the people that say the bottom was already in, and the third camp are the people that say the bottom will be between 28-33k. The largest supported opinion is the one that the bottom will be 40-50k, and thats what the mass is thinking. And here is the important part: I called 40-50k back at 120k at the top in October 2025, when nobody wanted to hear it and everyone was calling for new ATHs. The mass laughed at those targets back then, and now the same mass has adopted them as their own. I just recently changed my final target: instead of 40-50k, I now consider the current range down to 54k as the very interesting zone, and since my announcement I am buying BTC and ETH with 5% batches inside my 54-64k range. And here is the point everyone needs to understand: when the entire market agrees on the same bottom target in the same month, that target loses its power. The bottom the mass is waiting for is the bottom the market will not deliver in the way they expect. They are trading my old call. I have already moved on. And to give the best example: They are now believing in the four years cycle, but called it a disgrace at the top of 120k, so if they believe in the four years cycle, why did they not believe when the market hit 120k at the exact four years cycle peak, why are they cherry picking their cycle lows , and the answer can be found in their greed.
We Are Still in a Bear Market, and That Is Exactly Why I Am Buying. Bitcoin is not in a bull market. Bitcoin is in a bear market, and this is exactly the reason why I am buying. It is understandable that a fool sees only two states: bull market or bear market. It's the same fool who rushes into an intersection the moment the traffic light turns yellow, without looking left or right, simply because it was red a second ago and assumes green must come next. Only a fool enters an intersection on yellow without understanding what comes next. Markets work exactly the same way. They are not simply "bull" or "bear," especially during major tops and bottoms. The transition is where the biggest opportunities are created, yet it is also where the majority becomes the most confused.
When I say I anticipate the end of the bear market, that does not mean we are already in a bull market. It means I am accumulating during the bear market because I believe its final phase is approaching. That is exactly where the highest risk-adjusted returns have always been made. The greatest investments are made in bear markets, not after everyone agrees a bull market has already begun. So let me make this perfectly clear: we are still in a bear market. I have never claimed otherwise. The difference is that I am buying before the crowd recognizes the transition. Those who can only think in black and white fail to understand that accumulation happens before confirmation. By the time the market officially becomes a bull market in the eyes of the public, the biggest opportunity has already passed. I am actively accumulating Bitcoin, and my purchases are shared in real time in Premium. Every single purchase, every single DCA I do, is shared in real time in Premium, and for that reason I am not able to disclose my exact entries publicly. But the accumulation has started, and I am looking forward to accumulating more of BTC, ETH, and some altcoins that will be shared in Premium only. Join Premium here: https://t.co/iKJBbnCfrg
The MA200 Weekly: History Keeps Proving the Point
Bitcoin has lost its MA200 weekly once again on the weekly time frame, and that is not an issue at all. We all know that in history Bitcoin lost the MA200 weekly several times. In fact, every single time BTC traded below the MA200 weekly, it was a great buying opportunity, and history is proving my words. Look at the chart: the Buying Range sits exactly where price is trading right now, directly at and below the MA200 weekly, with the bottom formation building in front of us. This is not the zone where you panic. This is the zone where my positions are built.
Saylor Wants to Sell Where I Am Buying
And now to the most interesting news of the week. Saylor is now considering selling $5 billion worth of Bitcoin, at a price point where I started my recent accumulation. Read that again. The man who said he would never sell, who laughed at every of my warnings, who kept buying at 100k, 110k, 120k with leverage on top, is now considering selling $5 billion at the bottom of the cycle, in the exact zone where I am slowly and carefully buying since days. I warned about Saylor publicly at the top. I told him to take profits at 115-125k. He refused, he mocked the idea of ever selling, and now his structure is forcing his hand at 60k instead of 120k. This is what happens when you have no plan: the market makes the plan for you, and the market's plan is always worse than the one you refused to make yourself. If Saylor's $5 billion hits the market inside my zone, I welcome it. Forced selling from a trapped whale is exactly the kind of liquidity event that marks accumulation zones. I am planning to buy anything between 54-64k as announced, and if Saylor's supply gives us deeper prices inside that range, my average entry only gets better.
The Setup Going Into October
The chart marks the path: bottom formation building through the coming weeks, the Buying Range between 54-64k active. This aligns with everything I have laid out since the pivot. The mass waits for 40-50k in September-October. I accumulate 54-64k now.
Join Premium here: https://t.co/iKJBbnCfrg
THIS IS NO FINANCIAL ADVICE BUT EDUCATIONAL CONTENT ONLY.
Max Favorable +0.1%Max Adverse −1.5%ACTIVE
Scored Calls · Full Audit Trail
DR
𝕏
$BTC: Since two months we move sideway
As I said in June, 57-67k is the range
And the next leg down is programmed
Nothing to worry about, all is programmed
Max Favorable +0.6%Max Adverse −2.3%Opportunity 0.40Time 0.00Magnitude 0.40Score 0.16
DR
𝕏
$BTC: After ten months of constantly warning Saylor to realize gains, Saylor finally admits that Strategy needs to sell their Bitcoin! Not at 120k, not at 100k, not at 80k, no he decided to do this at 60k, calling it the "Monetization Program."
Now watch this: Saylor dumping BTC to protect his stock and pay out the dividends. And watch what happens when the market forces him to sell lower and lower, as the market forced him to sell! The panic will hit bigger once people realize the amount of BTC he has to sell to protect his USD reserve of 1.25bn, the dividend payments, and the re-purchase of MSTR stock.
This happens after months of predictions, and the timing couldnt be better, its happening right where I am expecting a large capitulation event to happen. Guess what I believe will lead to this event ? Good luck everyone.
Max Favorable +2.8%Max Adverse −12.6%Opportunity 0.57Time 0.03Magnitude 0.57Score 0.23
DR
𝕏
#Market:
I have never been positioned into more short positions than today, with over 120 active shorts across BTC, stocks, and indices. In other words, I have never been more heavily positioned for downside than I am right now.
Putting every single dollar in this trade!
Max Favorable +9.6%Max Adverse −4.7%Opportunity 0.73Time 0.68Magnitude 0.73Score 0.62
DR
𝕏
#Market:
I have never been positioned into more short positions than today, with over 120 active shorts across BTC, stocks, and indices. In other words, I have never been more heavily positioned for downside than I am right now.
I will lose everything if it doesn’t play out
Max Favorable +9.9%Max Adverse −4.3%Opportunity 0.74Time 0.77Magnitude 0.74Score 0.66
DR
𝕏
#Bitcoin – What's Next?
The Big Sunday Report: All We Need to Know
🚩 TA / LCA / Psychological Breakdown:
Everyone bullish here is making a big mistake, and don't misunderstand my words. I clearly speak about those who are buying now long term, believing the bottom was in. Everyone who is buying now is just flooding the market with liquidity the market needs, not only STRC, but also miners and other crypto businesses. While most altcoin businesses died on 10th October 2025, some crypto businesses, venture capitalists, hedge funds, custodians, lending platforms and yield protocols are on the verge of collapse, and ahead of them the golden horse and master of the collapse and the person who was the biggest loser of the DOT COM BUBBLE, in terms of BILLIONS of dollars lost, Michael Saylor and his company MicroStrategy. Again: everyone buying now is donating money to a collapsing system, and it's the crypto system that is collapsing NOW. I am not saying it won't recover, but I say it's not worth entering for now. I will enter, as I remain bullish on the long haul, but for now I don't even touch crypto products and am just waiting to buy the next leg down on Bitcoin that should bring us to the range of 50k and wicks below 50k. DrProfitPremium is for free till end of June. You can join now: https://t.co/SBmkqCqyeg
I described where I see the bottom last week, and two weeks ago, and even at 120k I said 60k will be the first bottom, and what follows needs to be the capitulation. I did that by sharing the boxes and stages, and clearly we are at Stage 5, the moment I am awaiting the capitulation to happen. Bitcoin has never bottomed out without a miner capitulation, so I am asking all those, and I wonder what inexperienced people they are, how do you call for a bottom without a clear miner capitulation? The miner capitulation that follows the sell-off is a blow of a large venture capitalist, fund, or even an exchange. Last year it was FTX, but also Three Arrows Capital (3AC), Alameda Research and its connections to FTX, Digital Currency Group / Genesis, BlockFi, Voyager, Celsius and so many other names that have been under extreme pressure, some on the verge of collapse and some that truly collapsed. Yet we haven't seen such an event this cycle, and I would even argue the crypto market is not strong enough to survive such a bear market without one more major casualty.
This aligns perfectly with what a former ETH Foundation staffer warned recently: that Ethereum could face a core developer funding crisis within 3–9 months. He says Ethereum needs roughly $30M per year to fund the ETH Foundation: and we speak about the same foundation that kept selling ETH, financing their own pockets, and now simply says they can no longer finance the project. People don't understand what this means. It tells us that the core developers of ETH won't be able to work on ETH in the future if there is no more funding, and with all the recent years we can clearly tell that ETH became a failure. Either you accept it, or you keep investing in a sinking ship. This is what I warn about: funding issues will hit centralized places, the large capitulation is ahead, and I don't see the bottom here.
The Chart and My Trading Plan
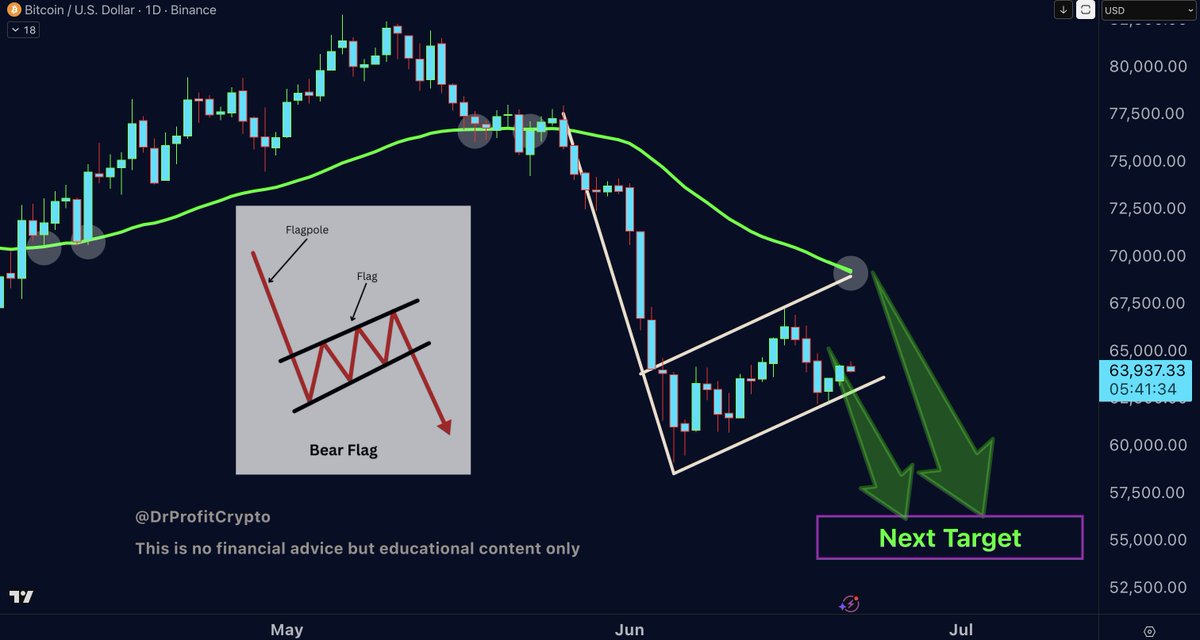
Bitcoin is now forming a massive bearish flag on the daily timeframe. I see a lot of noise regarding the current price and people talking about buying no matter at what price, and everyone seems to ignore the fundamentals, the on-chain data, the macro, and even the simplest chart analysis that shows a clear bearish flag right in front of us. The positivity in the market is back, and liquidity has started to build massively below us in the last 60 days.
So far in this cycle I have shorted at 120k, at 80-82k, and now I am looking to place short orders in the region of 68-69k. Two weeks ago I said I am expecting Bitcoin to pump towards 67-68k, and exactly as expected BTC went to 67k before starting to go down again. What many do not realize in a sideways move is that a price point can be visited several times, and I am now preparing my final short orders at 68-69k in case the market allows us to visit. Again: I am not saying with 100% these targets will be hit, as the momentum remains extremely bearish, but I am saying that if the market allows us to visit this area, I am willing to add to my shorts. My target is a dump to 54-56k region first before we move sideways once again and afterwards another leg down and the bottom is close in the region between 40-50k in my opinion.
The plan worked at 120k. The plan worked at 60k of phase 1. The plan worked at the 71k long. The plan worked at the 80-85k bull trap top. The plan is working now in Stage 5. The capitulation is ahead, and the CBB is the destination.
THIS IS NO FINANCIAL ADVICE BUT EDUCATIONAL CONTENT ONLY.
Max Favorable +10.0%Max Adverse −4.3%Opportunity 0.74Time 0.81Magnitude 0.74Score 0.67