@astrocryptoguru
“@astrocryptoguru holds a 52.4% all-time accuracy across 577 calls, improving to 55.9% YTD, with a focus on BTC, ETH, and SOL across mid- to long-term horizons. Accuracy climbs steadily with timeframe — peaking at 59.1% on long-term calls — suggesting an edge in patience over short-term timing.”
Score Breakdown
| CallRank Score | Move · Path · Time | Scored | |
|---|---|---|---|
| ALL-TIME | 52% | 0.63 · 0.51 · 0.52 | 609 |
| YTD | 55% | 0.63 · 0.57 · 0.58 | 268 |
| 30D | — | — | 0 |
CallRank Score by Duration
Short term47% 225 calls
Medium term53% 266 calls
Long term59% 118 calls
CallRank Score · Last 12 Months
Asset Breakdown — Top 5
| Asset | CallRank Score | Calls | 🟢 Bull · 🔴 Bear |
|---|---|---|---|
| BTC | 51% | 454 | 267 · 187 |
| ETH | 52% | 57 | 35 · 22 |
| SOL | 57% | 37 | 21 · 16 |
| ZEC | 51% | 16 | 7 · 9 |
| FARTCOIN | 62% | 12 | 9 · 3 |
Live Calls Summary · By Horizon
@astrocryptoguru's active forecasts grouped by horizon and asset. L = Long, S = Short, number = open call count.
Active assets for this forecaster:
| No assets selected | |
|---|---|
| ST | — |
| MT | — |
| LT | — |
ST = Short term · MT = Medium term · LT = Long term
Active Calls · 3 Live
AS
𝕏
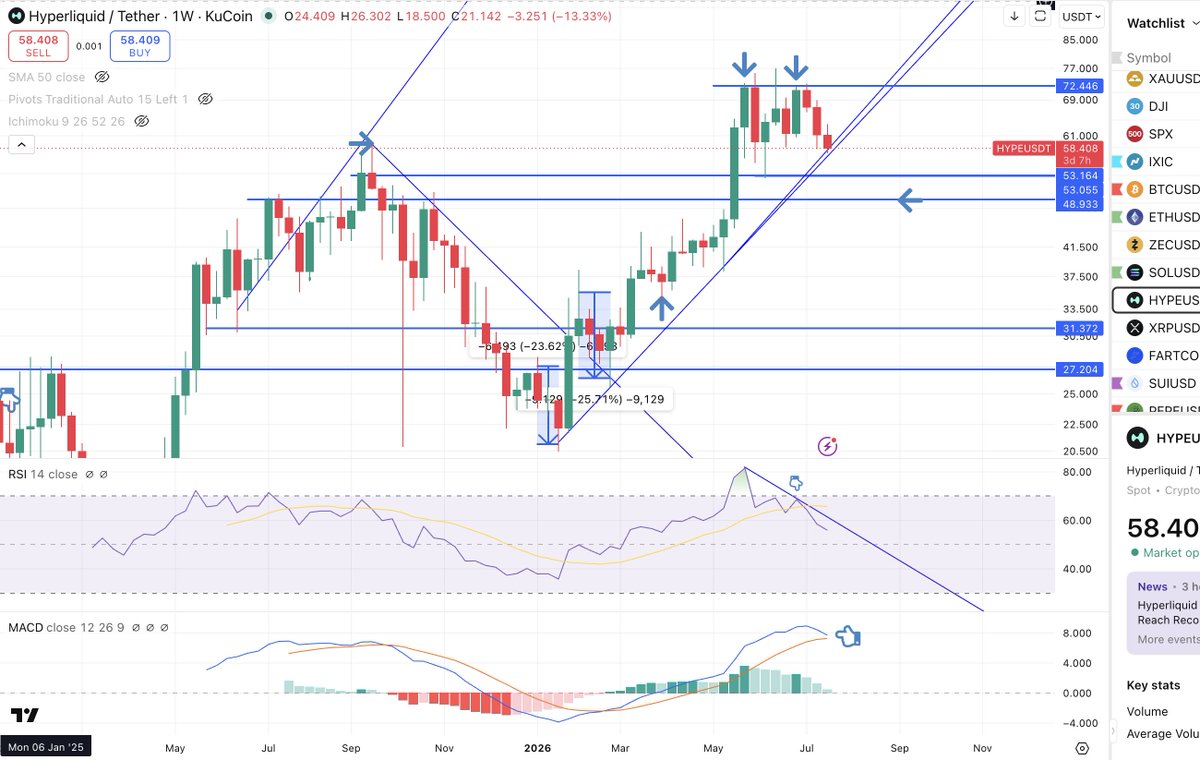
The bad news is it's probably over for hyperliquid:native
Classic Double top with a Bear Div on weekly RSI on the 2nd top AND Weekly MACD crossing red
this looks cooked
The Good news is you can short it with a stop loss to manage risk https://t.co/0LXVtcs3tr
Max Favorable +0.9%Max Adverse −0.9%ACTIVE
AS
𝕏
$BTC in trouble here
Three week rally barely making a dent in the bearish Weekly chart
Favorable rally window closing in a few days
Yikes https://t.co/fpmR3wUXag

Max Favorable +2.4%Max Adverse −1.8%ACTIVE
AS
𝕏
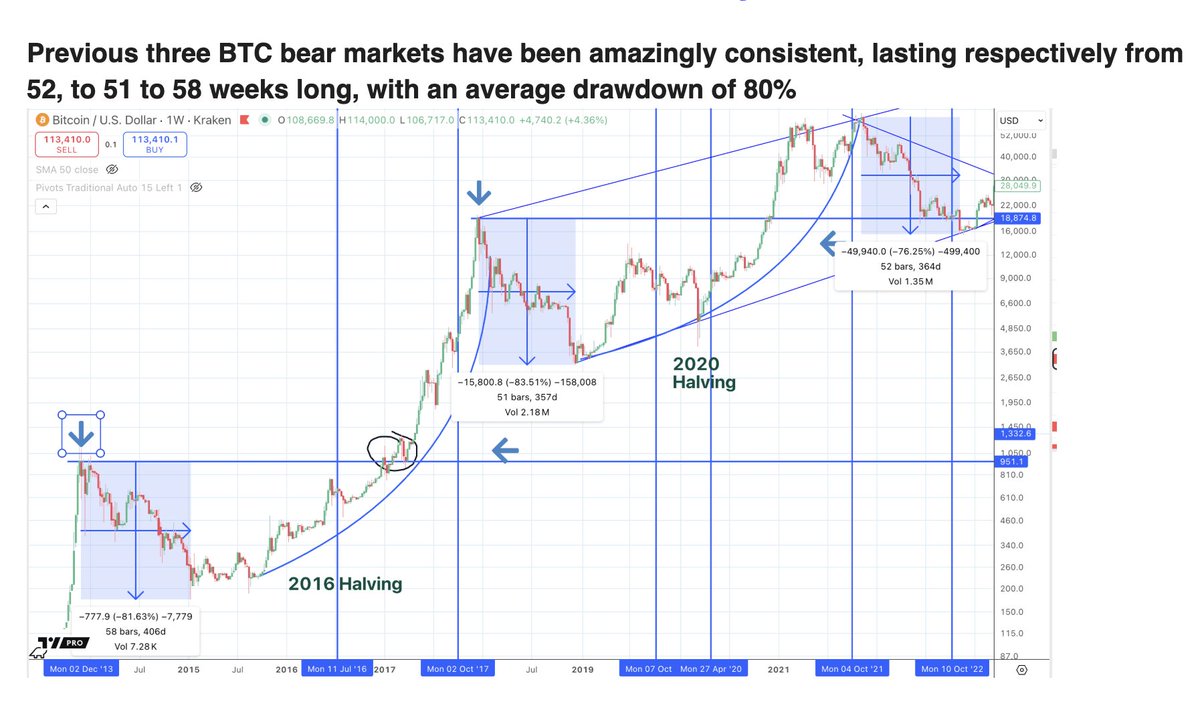
If you study the three previous bitcoin:native Bear Markets they have been incredibly consistent
Lasting 58, 51 and 52 weeks respectively
That puts a Cycle Bottom in Q4
Doesn't mean it will happen again exactly, but that's my base case until proven otherwise https://t.co/qFzd6dt9Xx
Max Favorable +6.7%Max Adverse −8.6%ACTIVE
Scored Calls · Full Audit Trail
AS
𝕏
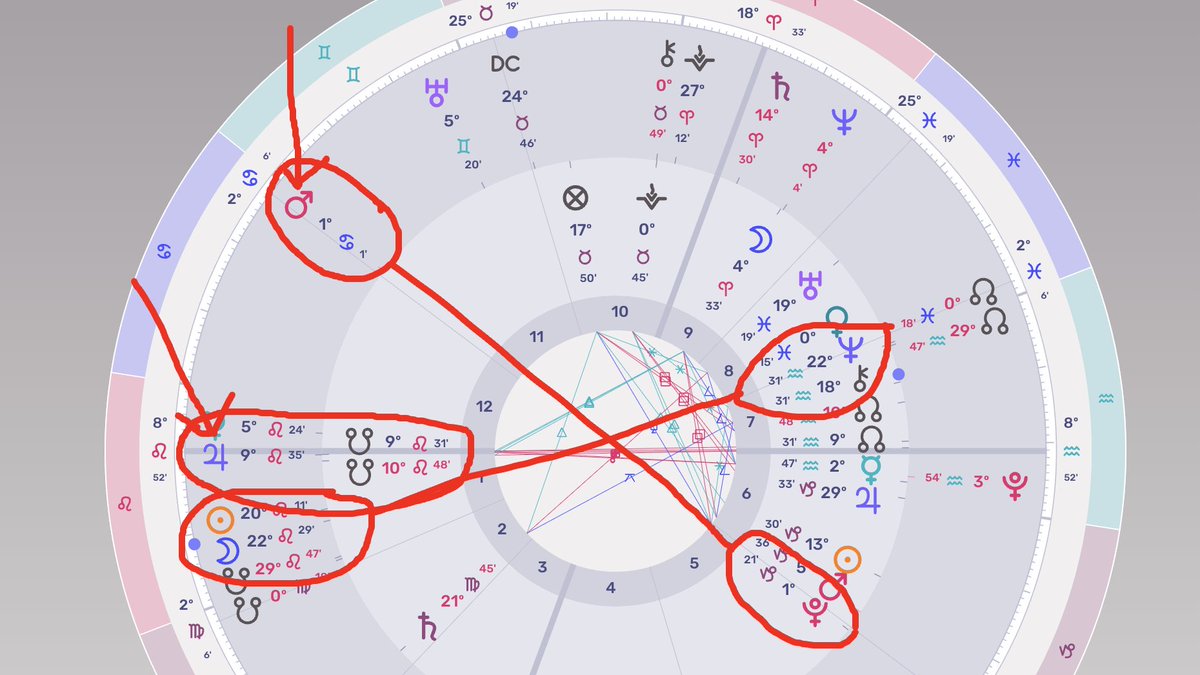
The main problem for bitcoin:native tomorrow Aug 12 isn't the eclipse
Although that's not helping and New Moons are often roughly Bear Pivot +/- even without eclipses
It's Jupiter on the BTC South Node which is typically a signal for losses and declines
and Mars opposing BTC natal Pluto, also a sign of breakdown and declines
Leans Bearish but Nothing is ever guaranteed, manage risk accordingly
Max Favorable +0.3%Max Adverse −0.3%Opportunity 0.38Time 0.47Magnitude 0.38Score 0.37
AS
𝕏
$BTC Crash Update
BTC clearly rejected 65300 and failed to make a higher high, instead making bearish pivot and back into the chop zone
This gave initial confirmation to bearish astrology signals
Now Aug 12-13 is a key to see some sharper declines, possibly down to $62200 where Bulls might mount a defense
Aug 16-18 is another period to see a major bearish breakdown
If $62200 BREAKS it's a pretty deep drop to the bottom of the range at 58k

Max Favorable +0.6%Max Adverse −0.0%Opportunity 0.58Time 0.75Magnitude 0.58Score 0.59
AS
𝕏
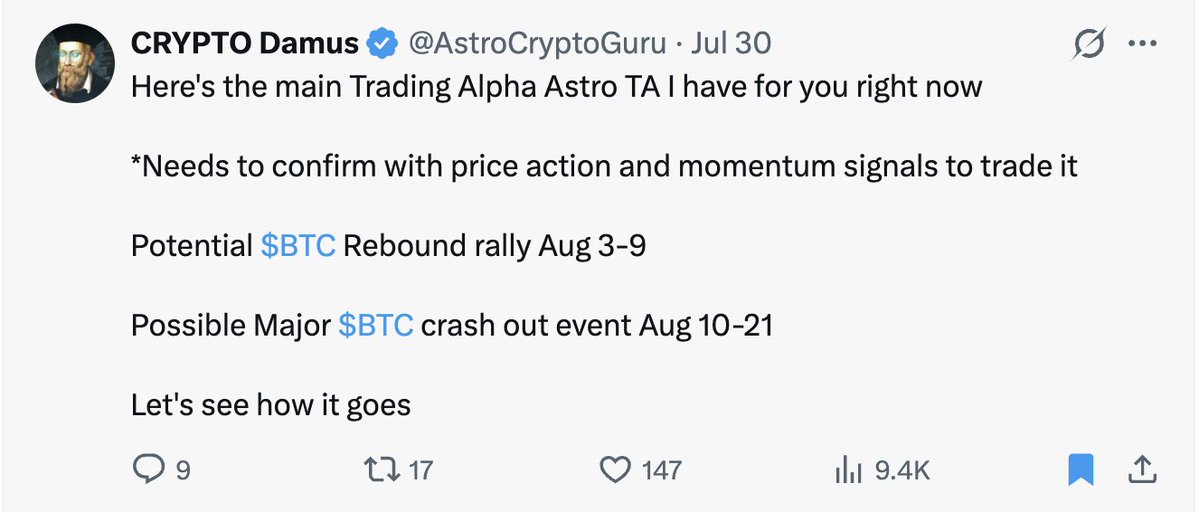
I called this short $BTC rally period 10 days ago, to the exact TOP day so far ...
very hard to pull off folks
Now the 10-11th is a bit of an in between Pivot period
But The 12th -21st has the signals for a potential crash out event
Stacking $Crypto Short positions https://t.co/cXZxQaFfYJ
Max Favorable +0.2%Max Adverse −0.1%Opportunity 0.29Time 1.00Magnitude 0.29Score 0.50
AS
𝕏
The $BTC astrology suggests BTC is running out of gas today or tomorrow
making a pivot to shorts
However the general astrology Venus grand trine is Aug 10-11 poses some conflicting signals
but we should not see any higher highs after Aug 11 or the trade is invalidated
Picking off exact tops is a tricky business but scaling in and having some limit sells place higher can work
Astro trading is predictive and seeks to front run the pivots so is inherently more risky
Don't get over exposed, Manage risk accordingly
Max Favorable +0.3%Max Adverse −0.6%Opportunity 0.33Time 1.00Magnitude 0.33Score 0.42
AS
𝕏
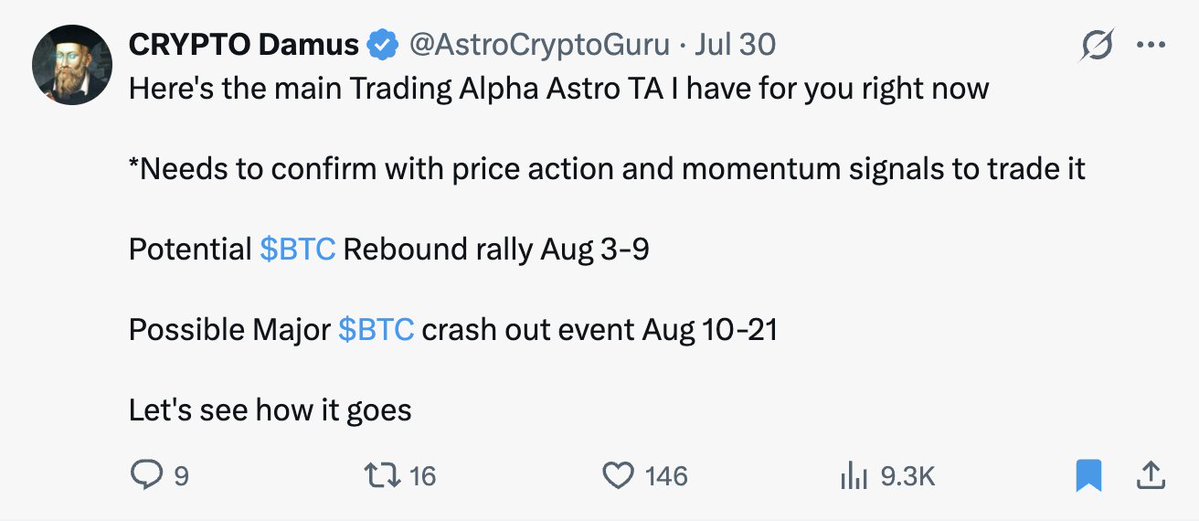
So far so good
$BTC did rally back to 65k in the Rebound period
Today is the last day of the favorable period, before the crash window starts
However these dates are +/- 1 day
Top can come today or tomorrow https://t.co/qvj1nGmxlM
Max Favorable +2.1%Max Adverse −0.4%Opportunity 0.78Time 0.83Magnitude 0.78Score 0.73