@ardinsc
“@ardinsc sits at 49.6% accuracy across 257 calls, focusing heavily on Break/Pump setups and covering assets like BTC, ETH, and smaller caps such as ASTER and ZEC. Accuracy improves with time horizon — from 48.4% short-term to 53.4% long-term — suggesting better edge when given more room to play out.”
Score Breakdown
| CallRank Score | Move · Path · Time | Scored | |
|---|---|---|---|
| ALL-TIME | 50% | 0.60 · 0.46 · 0.45 | 265 |
| YTD | 48% | 0.61 · 0.47 · 0.44 | 158 |
| 30D | — | — | 0 |
CallRank Score by Duration
Short term49% 143 calls
Medium term50% 92 calls
Long term53% 30 calls
CallRank Score · Last 12 Months
Asset Breakdown — Top 5
| Asset | CallRank Score | Calls | 🟢 Bull · 🔴 Bear |
|---|---|---|---|
| BTC | 46% | 138 | 65 · 73 |
| ETH | 58% | 32 | 18 · 14 |
| ZEC | 63% | 25 | 15 · 10 |
| ASTER | 51% | 24 | 11 · 13 |
| HYPE | 46% | 14 | 6 · 8 |
Live Calls Summary · By Horizon
@ardinsc's active forecasts grouped by horizon and asset. L = Long, S = Short, number = open call count.
Active assets for this forecaster:
| No assets selected | |
|---|---|
| ST | — |
| MT | — |
| LT | — |
ST = Short term · MT = Medium term · LT = Long term
Active Calls · 13 Live
AR
𝕏
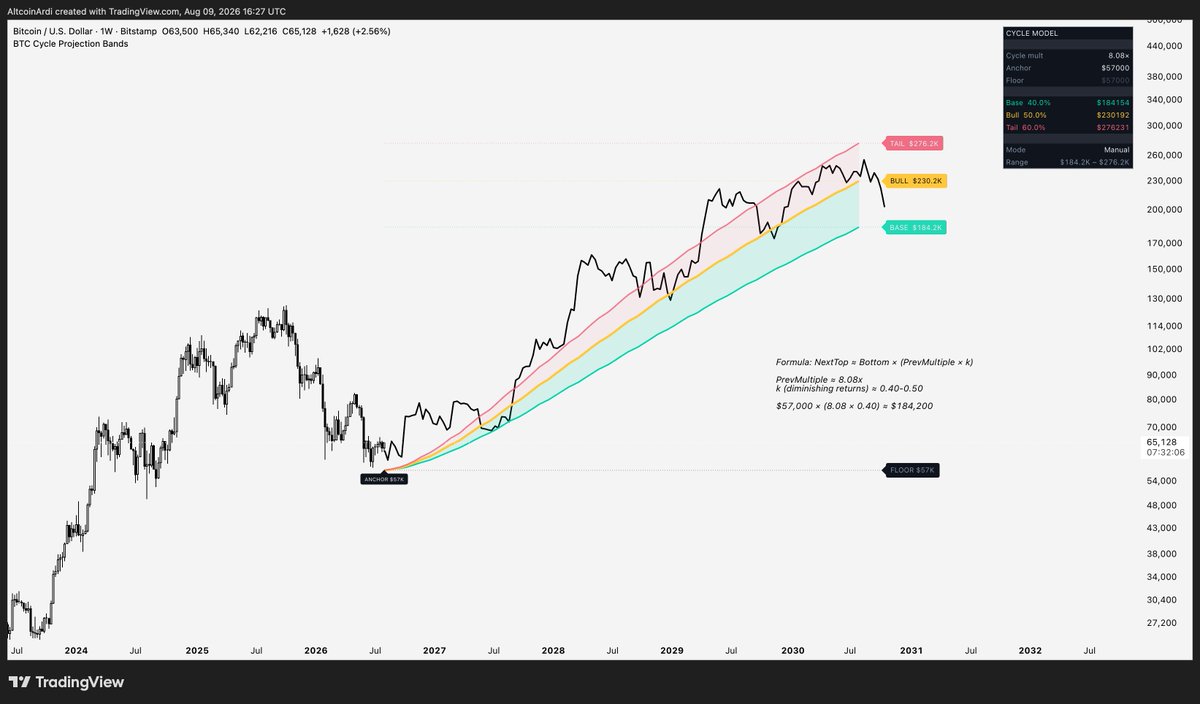
If $57K is truly the final $BTC cycle floor, Bitcoin does not need another explosive cycle multiple to trade well above $200K.
The previous bottom-to-top move produced approximately an 8.08x return.
My cycle projection assumes the next cycle retains only 40-50% of the previous multiple as Bitcoin matures, consistent with the historical rate of compression between cycles.
That reduces the expected upside to approximately 3.23x at the base and 4.04x under the bull case.
The formula is:
Next-cycle top ≈ cycle bottom × (previous multiple × diminishing factor)
Using the base case:
$57,000 × (8.08 × 0.40) ≈ $184,200
Increasing the diminishing factor to 0.50 moves the projection to approximately $230,200.
A stronger supercycle retaining 60% of the previous multiple would produce a 4.85x return and extend the upper band toward $276,200.
That would represent the extreme end of the projection model.
Ultimately, every $1,000 change in the eventual bottom moves the base projection by approximately $3,230, the bull projection by $4,040 and the euphoric projection by $4,850.
If $57K holds as the final low, the normal next-cycle top would sit between approximately $184K and $230K, with $276K representing a stronger euphoric extension.
If Bitcoin’s diminishing-return structure remains intact, this is where the next bull market would most logically reach its peak.
PENDING TRIGGER
AR
𝕏
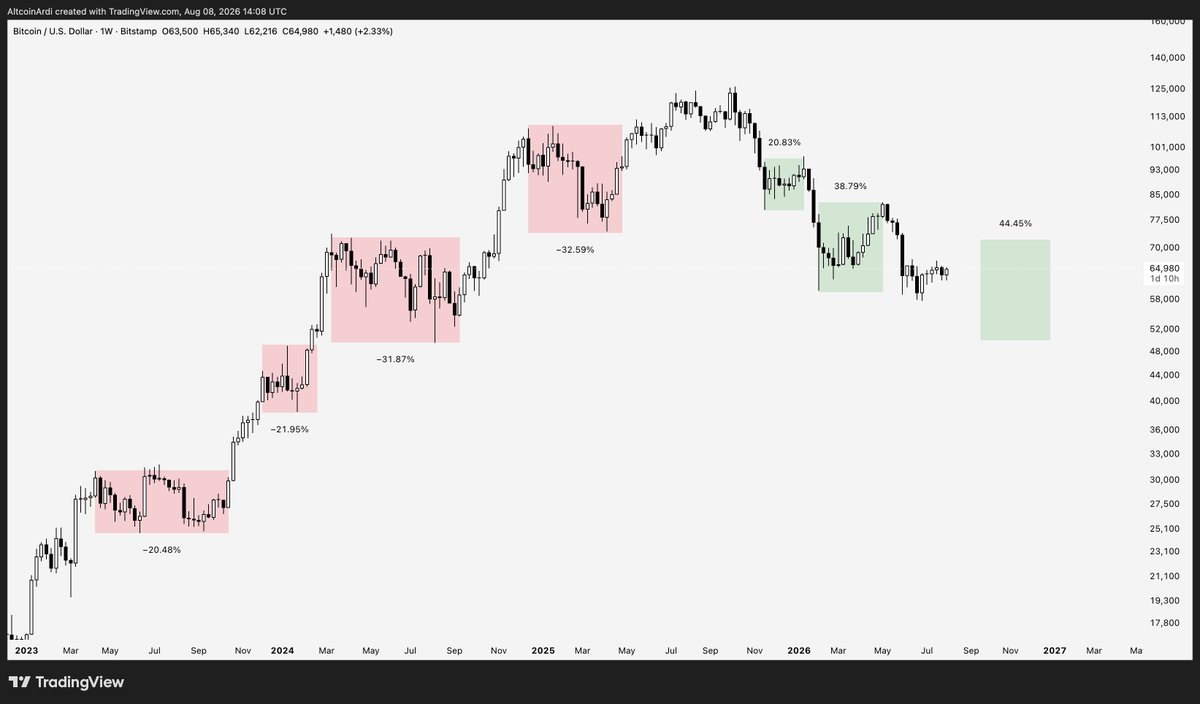
Study the symmetry on $BTC.
As the bull market matured, the pullbacks became deeper.
Now the same process is unfolding in reverse.
The macro trend remains down, but as the bear market matures, the rallies against it are becoming steeper and increasingly aggressive.
The next move lower will convince everyone that BTC is accelerating toward much lower prices.
I believe it will be followed by the largest rally of this entire bear market.
Max Favorable +0.1%Max Adverse −0.2%ACTIVE
AR
𝕏
What would convince me that $57K was the final $BTC cycle low?
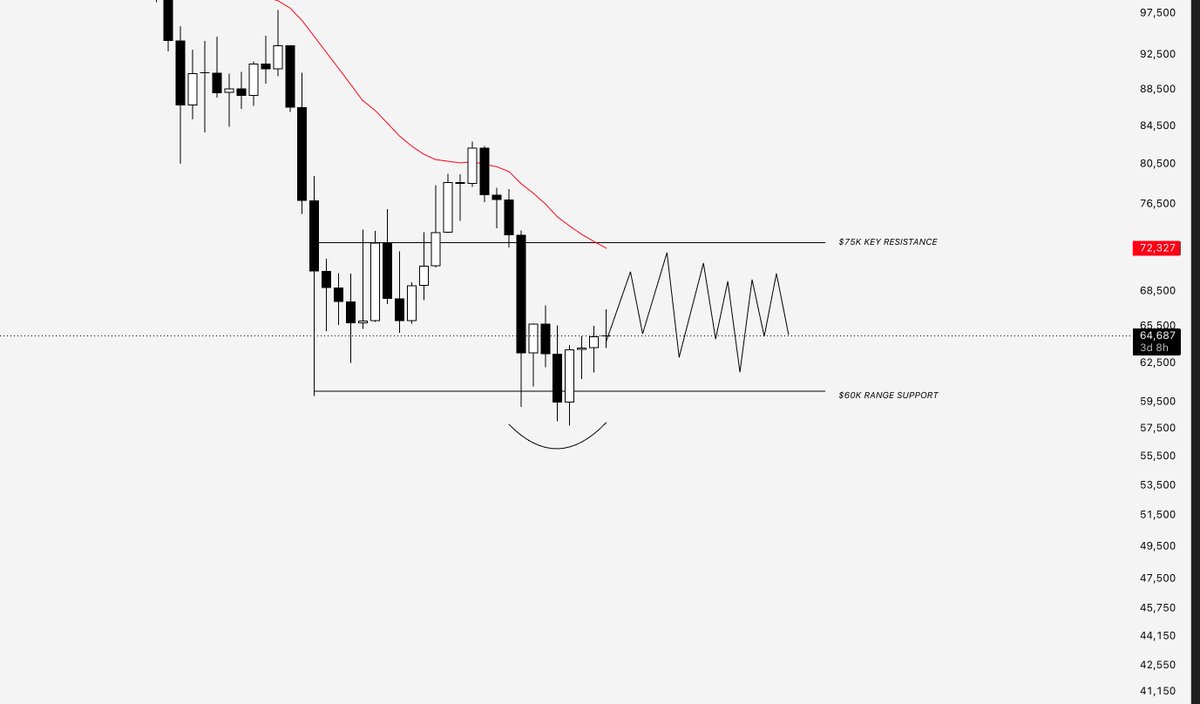
A break above $75K would be the earliest real indication.
That is the neckline of the prior range's double bottom. Reclaiming it would begin invalidating the higher-timeframe downtrend established from $126K.
However, the breakout alone would not be enough.
BTC would then need to sustain an extended rally or range sideways for several months.
Similar to the February rally, time would need to start working in favour of the bottoming thesis.
Right now, too much still argues against it.
We have not experienced a genuine bottoming phase or late capitulation. BTC has simply been grinding lower.
It would be the shallowest bear-market drawdown, roughly three months earlier than any previous cycle bottom, while the broader market structure remains in a bearish downtrend.
We're also now seeing markets pricing the equivalent of roughly two further rate hikes by year-end, which creates additional windows where macro conditions could lean against risk assets like BTC.
For $57K to remain the cycle low, BTC may need to survive all of this while holding its structure for more than three months.
It is possible.
But until $75K breaks and time begins confirming the move, $57K remains a major low, not necessarily the final low.
PENDING TRIGGER
AR
𝕏
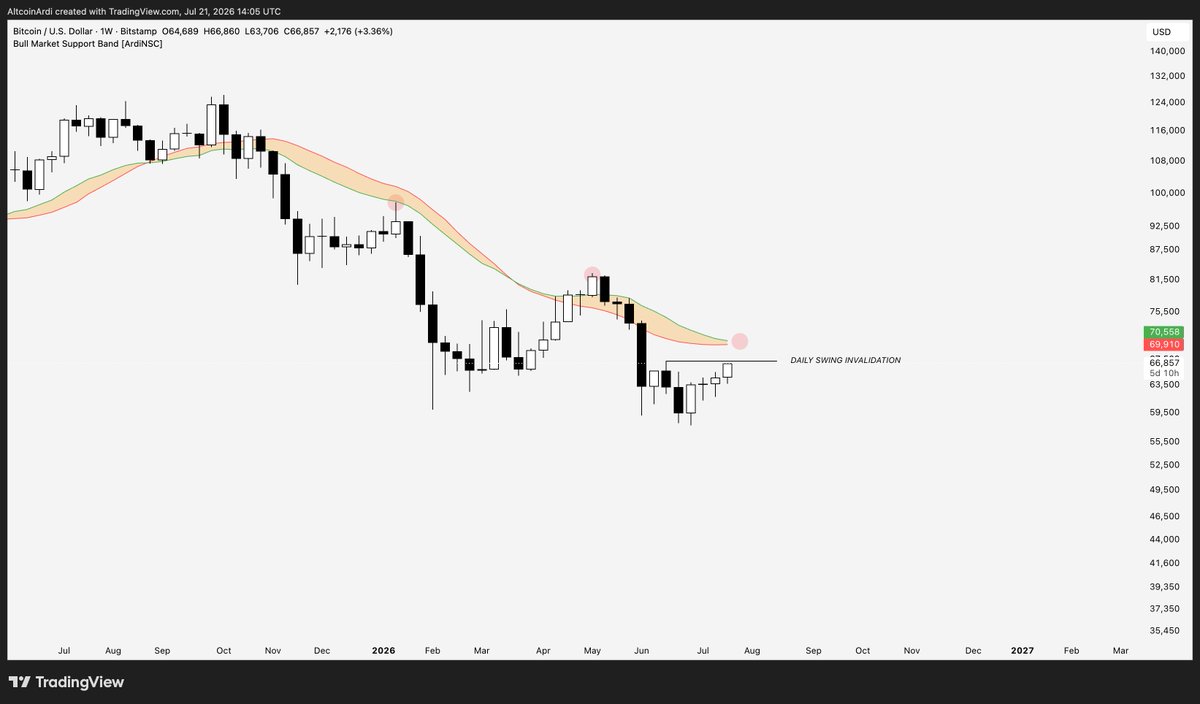
Every $BTC relief rally during this bear market has either tested or temporarily deviated above the Bull Market Support Band.
It currently sits around $69K-$70K.
If we invalidate the daily swing at $67K, then I think a third test of the band comes into play.
Unable to flip $67K, and we remain capped below HTF resistance.
PENDING TRIGGER
AR
𝕏
Every $BTC relief rally during this bear market has either tested or temporarily deviated above the Bull Market Support Band.
It currently sits around $69K-$70K.
If we invalidate the daily swing at $67K, then I think a third test of the band comes into play.
Unable to flip $67K, and we remain capped below HTF resistance.
PENDING TRIGGER
Scored Calls · Full Audit Trail
AR
𝕏
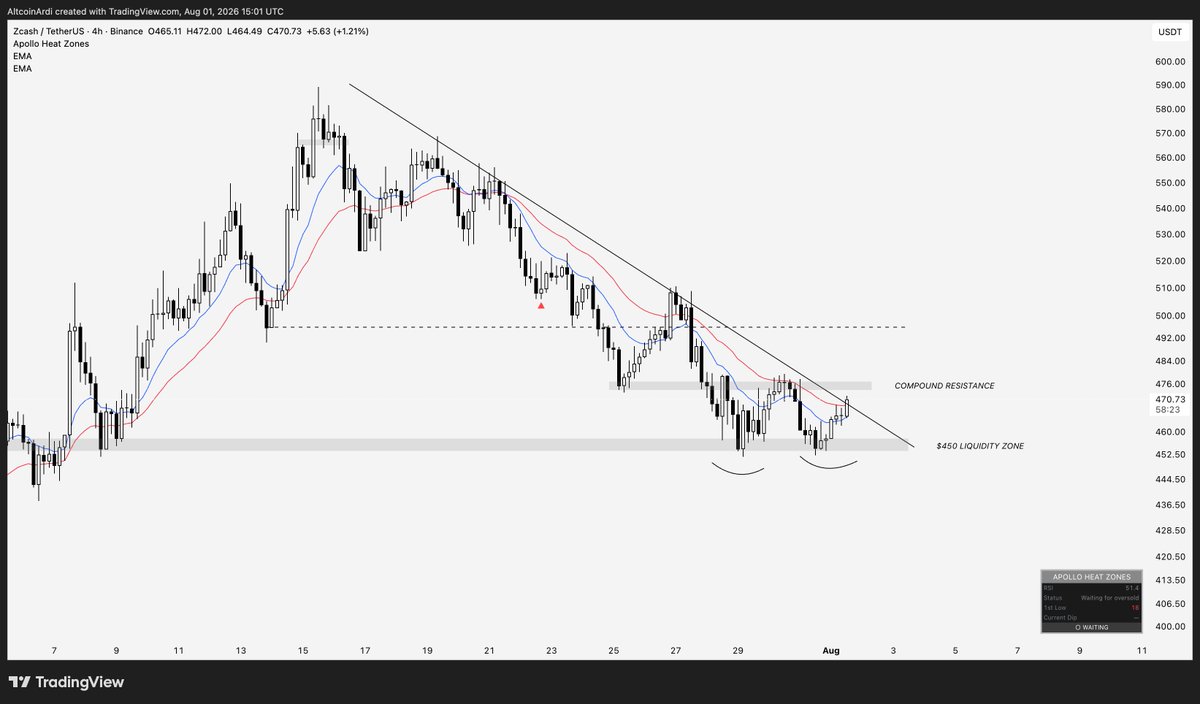
$ZEC is starting to look interesting again.
Price has formed a double bottom directly at the key $450 liquidity pivot, with compound resistance now sitting just above.
If ZEC can successfully break through that resistance, I’d be targeting a move into the $490-$500 region.
That’s where I’d reassess the strength of the move.
Either price shows enough momentum to continue higher, or it rejects and forms another lower high before the downtrend resumes.
Max Favorable +11.8%Max Adverse −2.6%Opportunity 0.83Time 0.93Magnitude 0.83Score 0.85
AR
𝕏
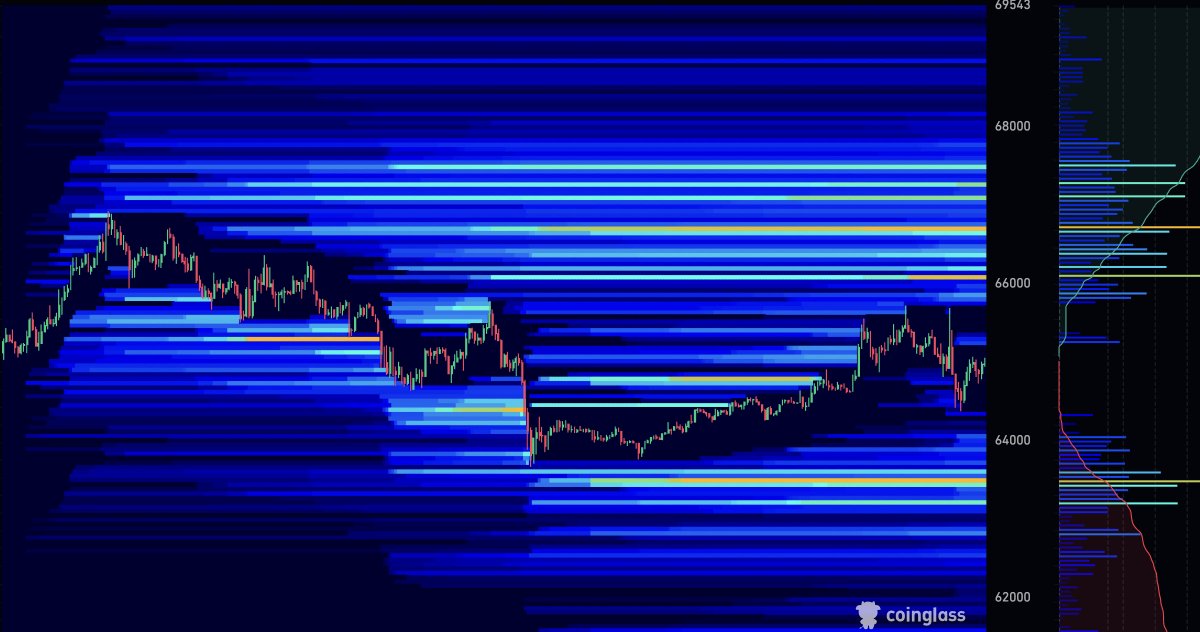
$BTC is building large amounts of liquidity on both sides of the current range.
Hence why I have no interest in positioning until we see one side cleared out.
Reclaim $65.5K and roughly $500M worth of short liquidity between $66K–$66.8K becomes the clear target.
Lose $64.2K and price likely hunts the $200M worth of long liquidity sitting underneath.
Until one of those pivots break, this remains range-bound PA.
Sideways chop until the market finally clears one side to fuel the directional move.
Max Favorable +1.1%Max Adverse −0.1%Opportunity 0.70Time 0.50Magnitude 0.70Score 0.54
AR
𝕏
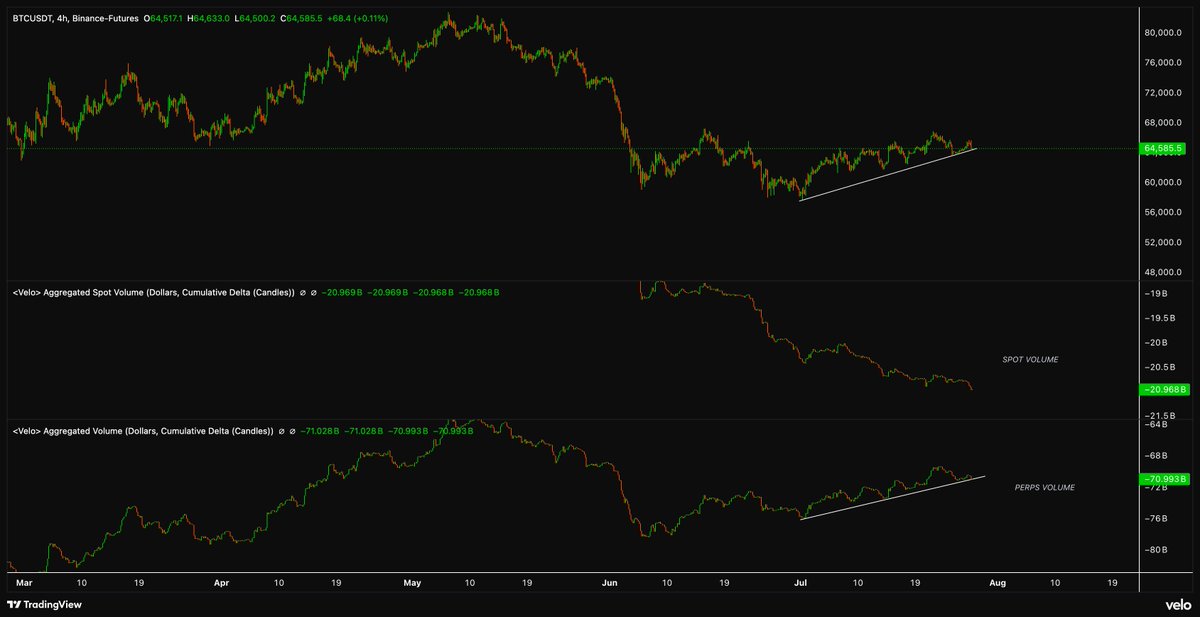
This $BTC rally will eventually fail like all others in this bear market.
Because it has the same structural flaw as every one before it.
Spot volume has fallen to a new cycle low while perp volume continues to mirror price higher.
This is now the third consecutive bear market rally where the same divergence has developed. Each completed example was followed by a 15–30% flush within weeks.
The mechanism is simple.
Once perpetual positioning begins to unwind, there is not enough spot demand underneath the structure to absorb the cascade.
Whether BTC tops at $67K or squeezes into $70K first changes very little.
As long as this divergence remains, the rally is still missing the spot demand needed to survive the unwind.
Max Favorable +3.8%Max Adverse −1.1%Opportunity 0.66Time 0.74Magnitude 0.66Score 0.61
AR
𝕏
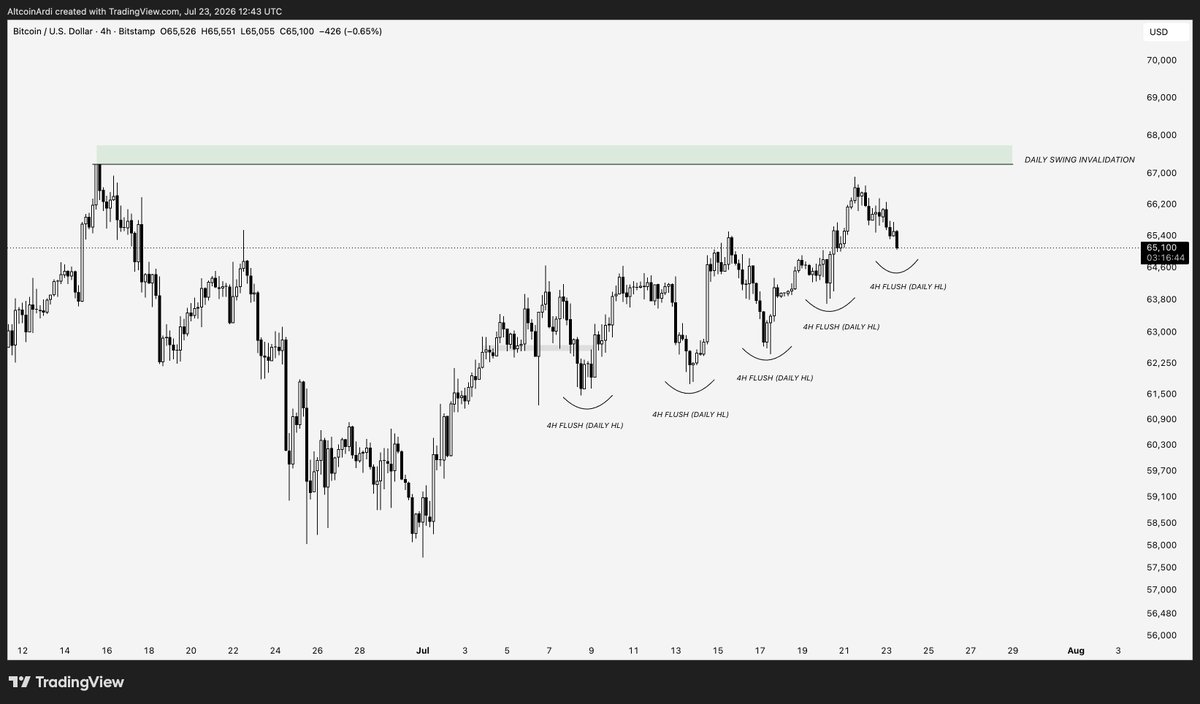
If this $BTC range continues following the same sequence, the next move should be a flush into $64K-64.5K to form another daily higher low before reattempting the range highs near $67K.
The pattern has repeated throughout the entire range.
Deep 4H flush to clear late longs and trap shorts > form a higher low > return to the highs.
A close below $64K would break the sequence.
Until then, I think this is another reset before another attempt at the range highs.
Max Favorable +3.7%Max Adverse −1.0%Opportunity 0.65Time 0.88Magnitude 0.65Score 0.67
AR
𝕏
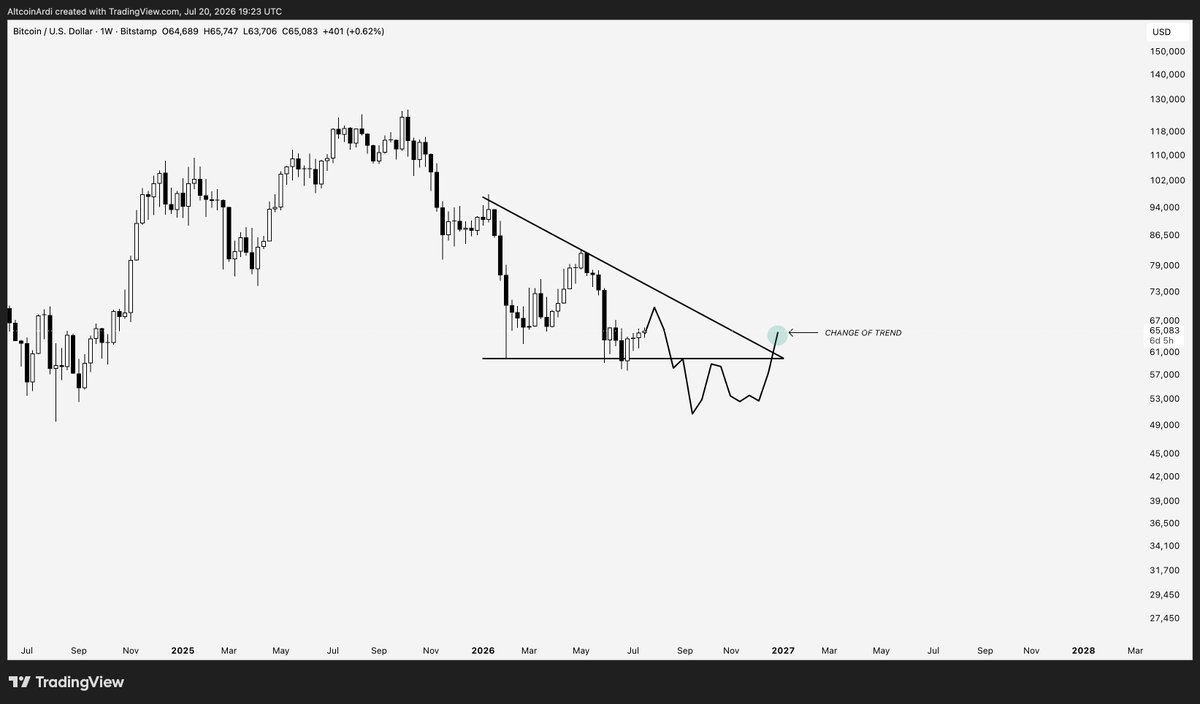
This is how I believe the final phase of the $BTC cycle unfolds.
Rally into August. One final correction into late September.
Build the cycle floor during Q4.
Then reclaim the long-term downtrend and begin the next cycle.
We’re not far. ✌️ https://t.co/uTHWjXM35x
Max Favorable +2.8%Max Adverse −4.4%Opportunity 0.84Time 0.30Magnitude 0.84Score 0.43