@merlijntrader
“@merlijntrader carries a 51.5% all-time accuracy across 2,369 calls, focusing on BTC, ETH, and altcoins like HBAR and AXL with a heavy lean toward long setups (86% bullish). Their strongest edge sits in mid-term Break/Pump calls, though a YTD dip to 42.4% suggests recent market conditions have been working against their predominantly bullish bias.”
Score Breakdown
| CallRank Score | Move · Path · Time | Scored | |
|---|---|---|---|
| ALL-TIME | 51% | 0.64 · 0.49 · 0.48 | 2578 |
| YTD | 42% | 0.59 · 0.41 · 0.38 | 1035 |
| 30D | — | — | 0 |
CallRank Score by Duration
Short term49% 203 calls
Medium term53% 969 calls
Long term49% 1406 calls
CallRank Score · Last 12 Months
Asset Breakdown — Top 5
| Asset | CallRank Score | Calls | 🟢 Bull · 🔴 Bear |
|---|---|---|---|
| BTC | 49% | 1708 | 1344 · 364 |
| ETH | 55% | 769 | 713 · 56 |
| HBAR | 47% | 21 | 21 · 0 |
| AXL | 35% | 11 | 11 · 0 |
| XRP | 40% | 10 | 10 · 0 |
Live Calls Summary · By Horizon
@merlijntrader's active forecasts grouped by horizon and asset. L = Long, S = Short, number = open call count.
Active assets for this forecaster:
| No assets selected | |
|---|---|
| ST | — |
| MT | — |
| LT | — |
ST = Short term · MT = Medium term · LT = Long term
Active Calls · 50 Live
ME
𝕏
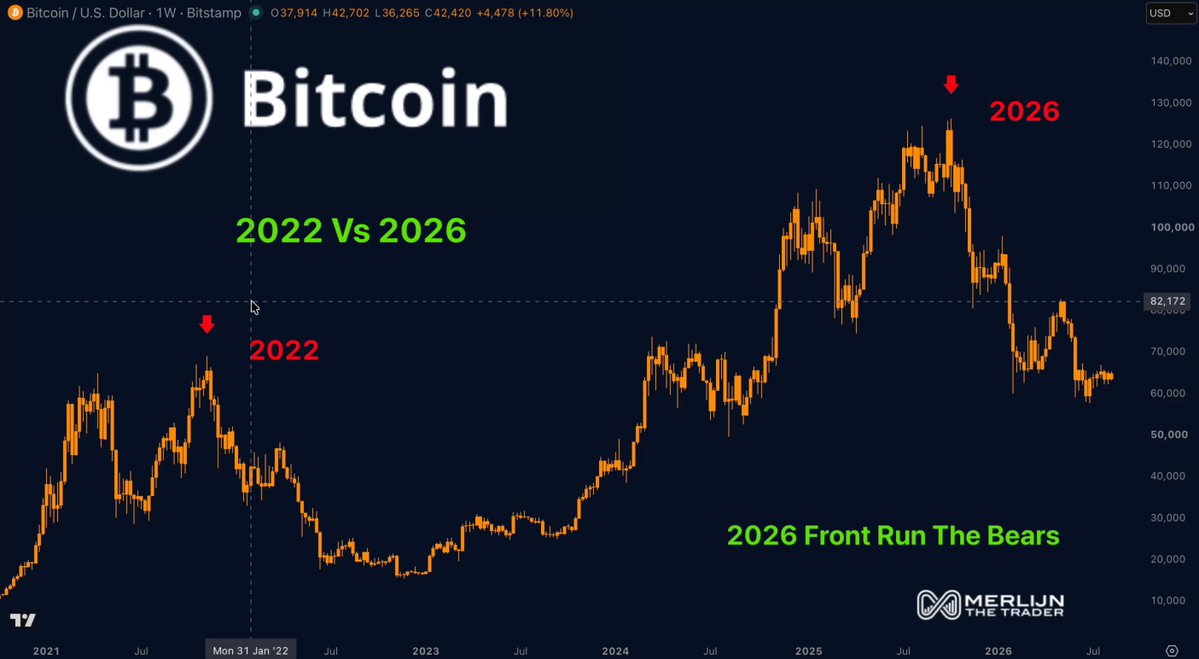
BITCOIN BEARS WANT $40K. THE CHART THEY'RE USING SAYS THEY MISSED THE BOTTOM.
Everyone lays 2022 over 2026.
That pushes the low months into the future and has people waiting on a date instead of a level.
Flip it. Put 2026 over 2022 and the structures line up on price.
The low sits where Bitcoin has already traded.
Now look at the room. All of CT is bearish. The news is bearish. The consensus thesis is down.
That has always been one of the better indicators, and it rarely points where the crowd thinks it does.
Price $63,526. Lose $58K on a weekly close and my alignment is wrong.
Max Favorable +1.0%Max Adverse −0.8%ACTIVE
ME
𝕏
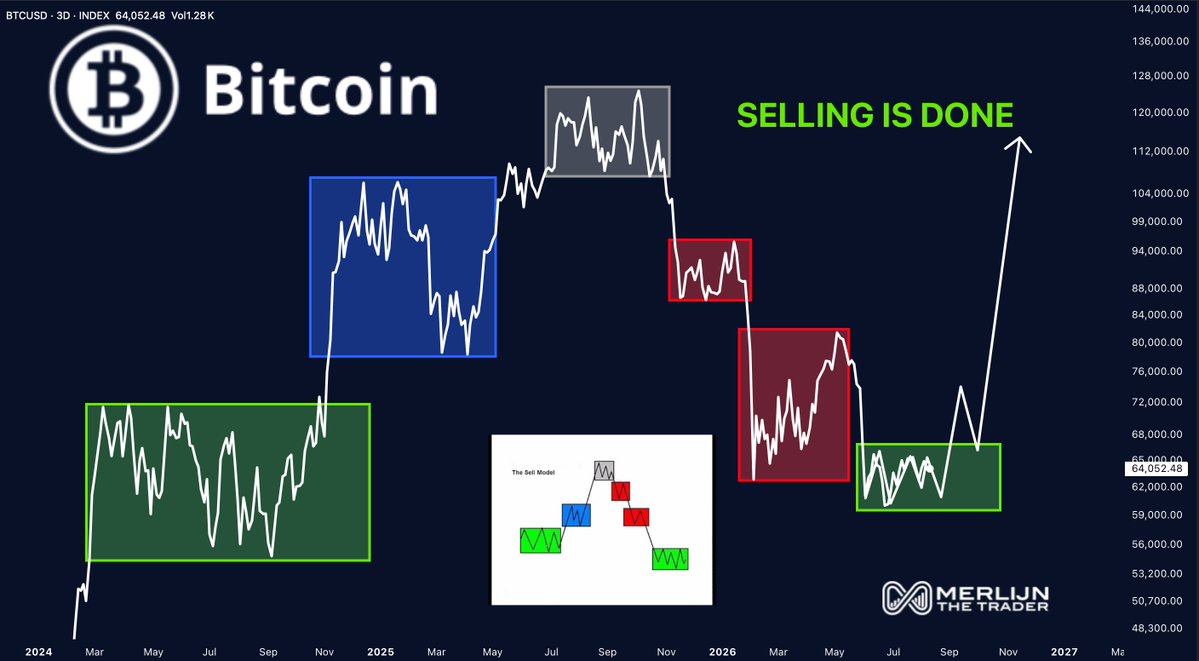
THE BITCOIN SELLING HAS STOPPED. MOST PEOPLE WON'T NOTICE FOR MONTHS.
The sell model has five steps.
Base, expansion, top, then two distribution ranges. Every one printed since 2024.
Price $64,055, sitting in the fifth box. That's the one where selling ends.
Lose $58K on a weekly close and the model failed.
Distribution doesn't end with a crash. It ends with a range nobody wants to trade.
PENDING TRIGGER
ME
𝕏
EVERY PART OF THIS ETHEREUM SEQUENCE IS DESIGNED TO MAKE YOU SELL. YOU'RE AT THE LAST PART.
Two bear flags. Two flushes. Then the base. Same order, same disbelief at the same point.
2025 ran that sequence and the move out of the base was vertical.
2026 has printed all four parts. Price is at $1,912, sitting where the previous version turned.
And then most people will call for lower prices and miss the move.
Make sure you're not buying at $3,000. DCA while it's still discounted.

Max Favorable +0.9%Max Adverse −0.4%ACTIVE
ME
𝕏
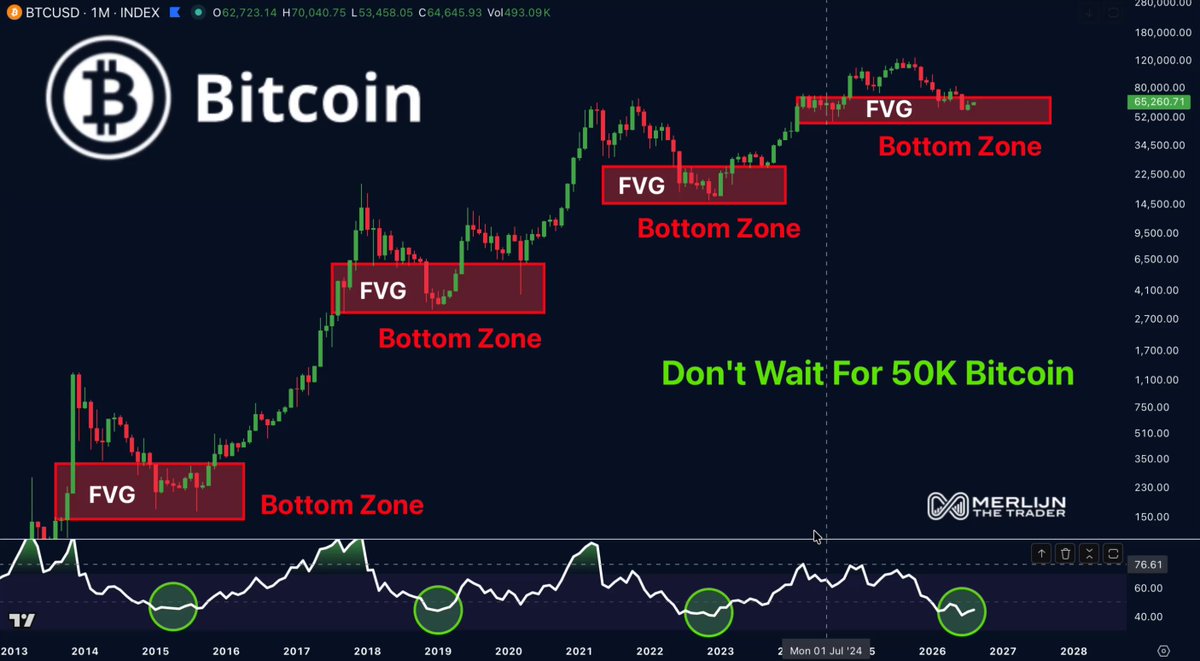
BITCOIN BEARS WILL TELL YOU TO WAIT FOR $50K. IF IT WAS THAT EASY, EVERYONE WOULD BE RICH.
Bitcoin leaves a monthly fair value gap on the way up every cycle. Price comes back, fills it, and turns. 2014, 2018 and 2022 all did exactly that.
The bottom of that gap sits at $55,232. That's the level, not some round number underneath it.
Price is at $65,256, inside the fourth gap, with RSI on the same support level that marked the other three.
$50K sits below the gap. The market has no reason to go get it.
Max Favorable +0.0%Max Adverse −2.2%ACTIVE
ME
𝕏
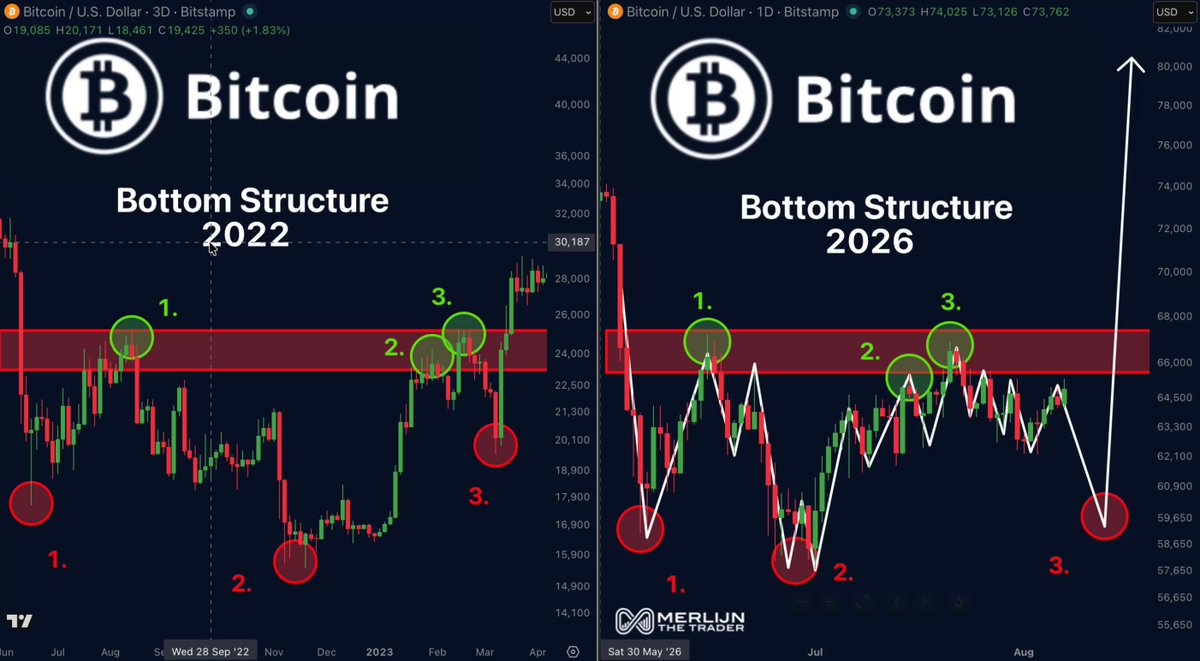
YES, ONE MORE FLUSH IS COMING. NO, NOT TO $50K.
The 2022 bottom had a specific shape. Three lows underneath.
Three taps into resistance above. Then one last sweep that took out the previous low and ended it.
2026 has printed everything except that final sweep.
The mistake people make is assuming it has to be deep. In 2022 it wasn't. It cleared the low and turned.
Price is at $64,927. I'm expecting that sweep into $59K–$60K, not $20K lower.
Lose $58K on a weekly close and the whole structure is wrong.
The last flush isn't the crash. It's the receipt.
Max Favorable +0.1%Max Adverse −0.3%ACTIVE
Scored Calls · Full Audit Trail
ME
𝕏
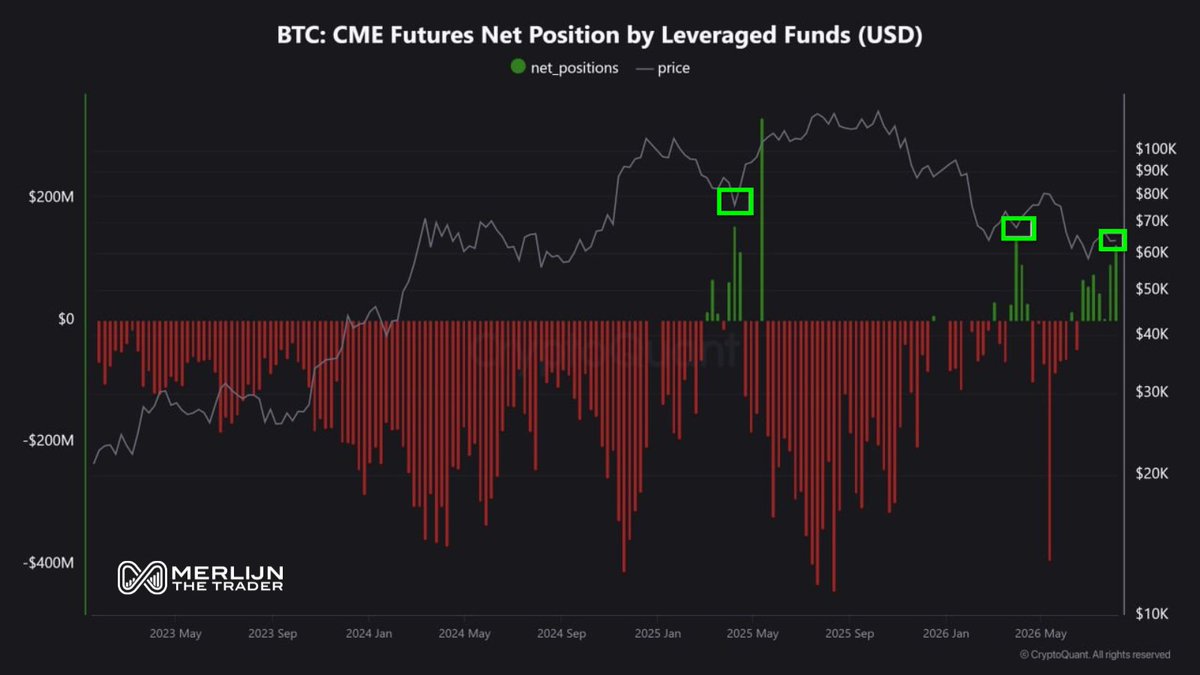
ONE BITCOIN CHART NOBODY IS TALKING ABOUT
CME leveraged funds have been net short Bitcoin for most of three years. Consistently. Structurally.
They flipped long twice.
April 2025: +30%.
March 2026: +30%.
The smartest leveraged money on the CME just flipped directional for the third time.
Retail is bearish. Quantum fears. CLARITY delayed. Death Cross. The funds are positioned the other way.
Watch what they do. Not what you feel.
Max Favorable +0.2%Max Adverse −0.2%Opportunity 0.23Time 1.00Magnitude 0.23Score 0.45
ME
𝕏
FIVE THINGS THAT SHOULD HAVE DUMPED BITCOIN BELOW $50K. NONE OF THEM DID.
The last two months delivered: Saylor selling, Coldcard wallets drained, US-Iran escalation, yen intervention, and Clarity getting delayed.
That's five reasons to dump, spread across supply, security, geopolitics, macro and regulation.
Bitcoin went sideways and held above $60,000.
Markets fall on bad news when there are still people left to sell. This one had five chances and didn't take any of them.
Bad news everywhere you look. That's what bottoms sound like. Tops sound like everyone agreeing it goes higher.
This is the part where you DCA. Not the part where you wait.

Max Favorable +0.7%Max Adverse −0.0%Opportunity 0.63Time 1.00Magnitude 0.63Score 0.66
ME
𝕏
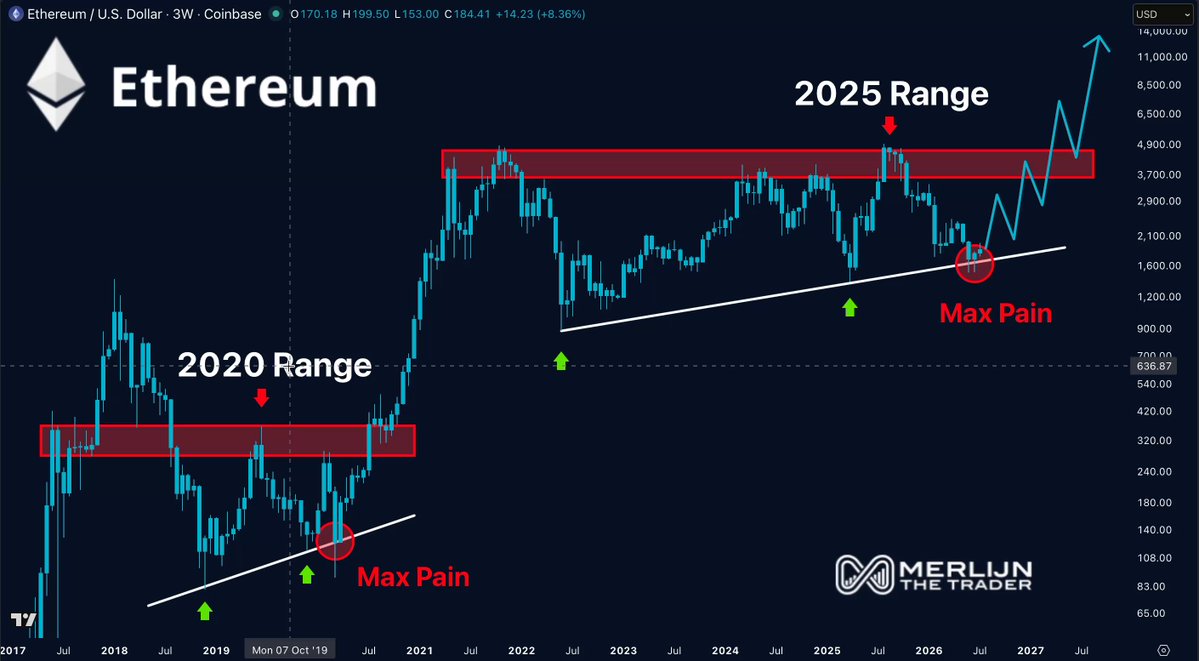
MAX PAIN IS WHERE THE TREND LINE AND EXHAUSTION MEET.
MEANWHILE ETHEREUM IS ALREADY UP 27%.
The line sits at $1,530. That's where 2020 touched at $110, right before the run to $4,900.
Hope you weren't waiting for $1,400.
The move already started. https://t.co/urkQ2FWCTA
Max Favorable +0.1%Max Adverse −0.9%Opportunity 0.08Time 0.00Magnitude 0.08Score 0.04
ME
𝕏
My community and I are going to short Bitcoin. 📉
The setup is here.
If you want to know where, why, and how we’re taking the trade…
DM me “SHORT”. https://t.co/yg1DHi6hM8

Max Favorable +0.1%Max Adverse −1.1%Opportunity 0.16Time 0.00Magnitude 0.16Score 0.07
ME
𝕏
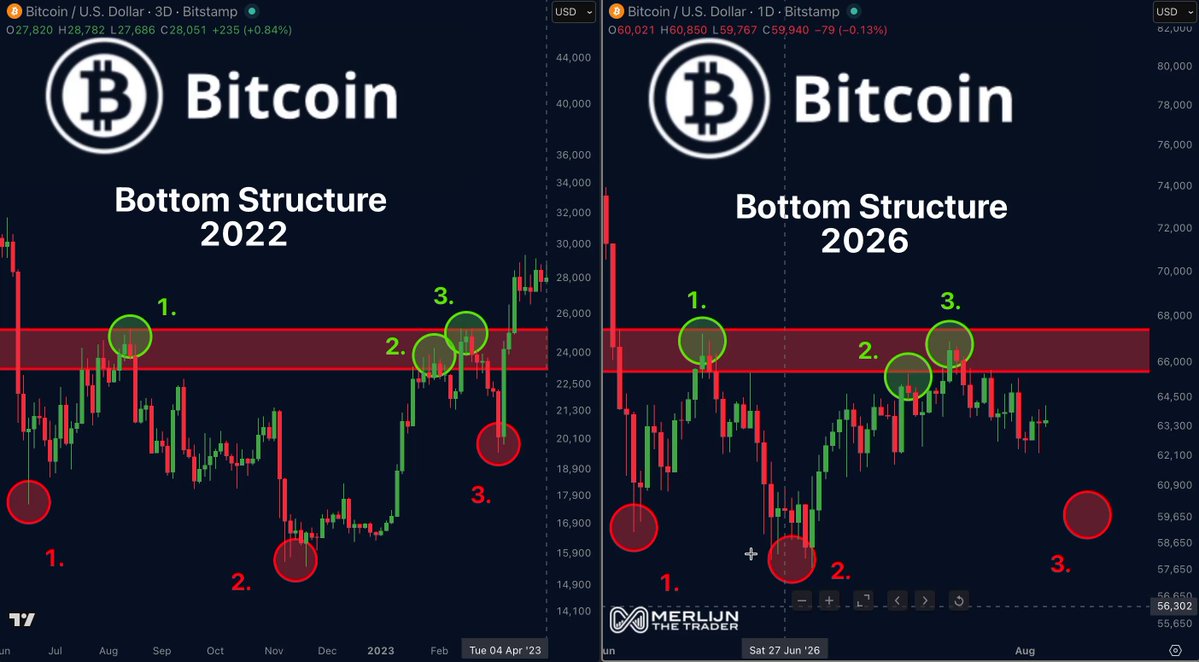
YES, 2026 LOOKS LIKE 2022. THAT'S WHY $40K IS THE WRONG CONCLUSION.
Both charts show the same bottom structure. Three lows underneath. Three taps into the same resistance box above.
What people forget is what came next in 2022: one final flush after the third tap, then the move.
Not a new bear leg. A liquidation event.
2026 has printed everything except that last piece. Price is at $63,592.
I expect the flush this week, into $60K–$61K. That's where my orders sit and where I will open a big position
Lose $58K on a weekly close and I'm wrong about the whole structure.
The bottom is in. The pain isn't finished.
Max Favorable +0.1%Max Adverse −3.1%Opportunity 0.12Time 0.00Magnitude 0.12Score 0.04