@matthewhyland_
“@matthewhyland_ posts 47% accuracy across 108 calls, focusing predominantly on bullish setups for BTC, ETH, XRP, and SPX across short and mid-term horizons, though YTD accuracy has dipped to 35%. Their edge leans toward Break/Pump setups, where a pattern-driven approach to momentum entries makes up the bulk of their call volume.”
Score Breakdown
| CallRank Score | Move · Path · Time | Scored | |
|---|---|---|---|
| ALL-TIME | 46% | 0.64 · 0.44 · 0.46 | 124 |
| YTD | 36% | 0.57 · 0.32 · 0.32 | 40 |
| 30D | — | — | 0 |
CallRank Score by Duration
Short term52% 12 calls
Medium term49% 76 calls
Long term37% 36 calls
CallRank Score · Last 12 Months
Asset Breakdown — Top 5
| Asset | CallRank Score | Calls | 🟢 Bull · 🔴 Bear |
|---|---|---|---|
| BTC | 48% | 106 | 98 · 8 |
| ETH | 31% | 13 | 12 · 1 |
| SOL | 71% | 1 | 1 · 0 |
| XMR | 63% | 1 | 1 · 0 |
| DOG | 35% | 1 | 1 · 0 |
Live Calls Summary · By Horizon
@matthewhyland_'s active forecasts grouped by horizon and asset. L = Long, S = Short, number = open call count.
Active assets for this forecaster:
| No assets selected | |
|---|---|
| ST | — |
| MT | — |
| LT | — |
ST = Short term · MT = Medium term · LT = Long term
Active Calls · 15 Live
MA
𝕏
The exact bottom being in or not should not be the primary focus
The primary focus should be that the upside heavily outweighs the downside
#Crypto has not been this offsides since 2016 & 2020
#BTC 50k is the new 12k
It does not matter over the coming years
Max Opportunity
Max Favorable +0.8%Max Adverse −0.1%ACTIVE
MA
𝕏
#BTC
Macro-Risk Ratios are turning bullish as the Macro-Risk exits the Bear Market here in 2026 for the first times since 2012-2016-2020
All of the expansive moves for BTC have taken place in a Macro-Risk Bull Market
The real expansive bull run is very close to starting: https://t.co/n8Wr8Pl2Rp

Max Favorable +0.1%Max Adverse −0.2%ACTIVE
MA
𝕏
So many declaring #ETH and #Crypto dead right as the Macro-Risk is exiting its Bear Market that lasted from 2022 to 2026
The prior times Macro Risk exited a Bear Market was in the middle of 2016 & 2020
Both of those exits were max opportunity for ETH and Crypto
Max Favorable +0.3%Max Adverse −6.3%ACTIVE
MA
𝕏
#BTC is perfectly healthy against the S&P500
When the Macro-Risk was turning in 2016 & 2020 BTC vs S&P500 was down -40% & -33% at those times
Currently as the the same turn is occurring for the first time since 2020 BTC/S&P500 is only down 7% from the prior high that is aligned with the Macro-Risk high which occurred in 2021 as shown by Copper/Gold, PMI, RUSSEL/S&P500, RUSSELL/NASDAQ
BTC got ahead of itself the past few years and outperformed during a period where historically it did not have success in the past as shown below (2014-2016 & 2018-2020 and now 2022-2026)
Now its finally getting the favorable conditions that it experienced in 2016-2017 and 2020-2021 for the first time since then
This favors that BTC is set to have its real bull run over the coming years and is perfectly healthy against the S&P500 despite it not appearing so on the surface - It got far ahead of where it should have been and now has returned back to the appropriate position and arguably even still better positioned than where it was the prior two times as these shifts occurred in 2016 and 2020 as its down much less than those times currently
This also applies to #ETH and the rest of the #Crypto market; the position of BTC Dominance, Altcoin Dominance, ETHBTC are identical to where they were in 2016 & 2020
Stay zoomed out as this will take multiple years to play out (due to the macro risk cycle extending in time) but the most bullish period is ahead and its all positioned appropriately as it was in 2016 & 2020

Max Favorable +15.4%Max Adverse −3.5%ACTIVE
MA
𝕏
#BTC is perfectly healthy against the S&P500
When the Macro-Risk was turning in 2016 & 2020 BTC vs S&P500 was down -40% & -33% at those times
Currently as the the same turn is occurring for the first time since 2020 BTC/S&P500 is only down 7% from the prior high that is aligned with the Macro-Risk high which occurred in 2021 as shown by Copper/Gold, PMI, RUSSEL/S&P500, RUSSELL/NASDAQ
BTC got ahead of itself the past few years and outperformed during a period where historically it did not have success in the past as shown below (2014-2016 & 2018-2020 and now 2022-2026)
Now its finally getting the favorable conditions that it experienced in 2016-2017 and 2020-2021 for the first time since then
This favors that BTC is set to have its real bull run over the coming years and is perfectly healthy against the S&P500 despite it not appearing so on the surface - It got far ahead of where it should have been and now has returned back to the appropriate position and arguably even still better positioned than where it was the prior two times as these shifts occurred in 2016 and 2020 as its down much less than those times currently
This also applies to #ETH and the rest of the #Crypto market; the position of BTC Dominance, Altcoin Dominance, ETHBTC are identical to where they were in 2016 & 2020
Stay zoomed out as this will take multiple years to play out (due to the macro risk cycle extending in time) but the most bullish period is ahead and its all positioned appropriately as it was in 2016 & 2020
Max Favorable +6.5%Max Adverse −3.0%ACTIVE
Scored Calls · Full Audit Trail
MA
𝕏
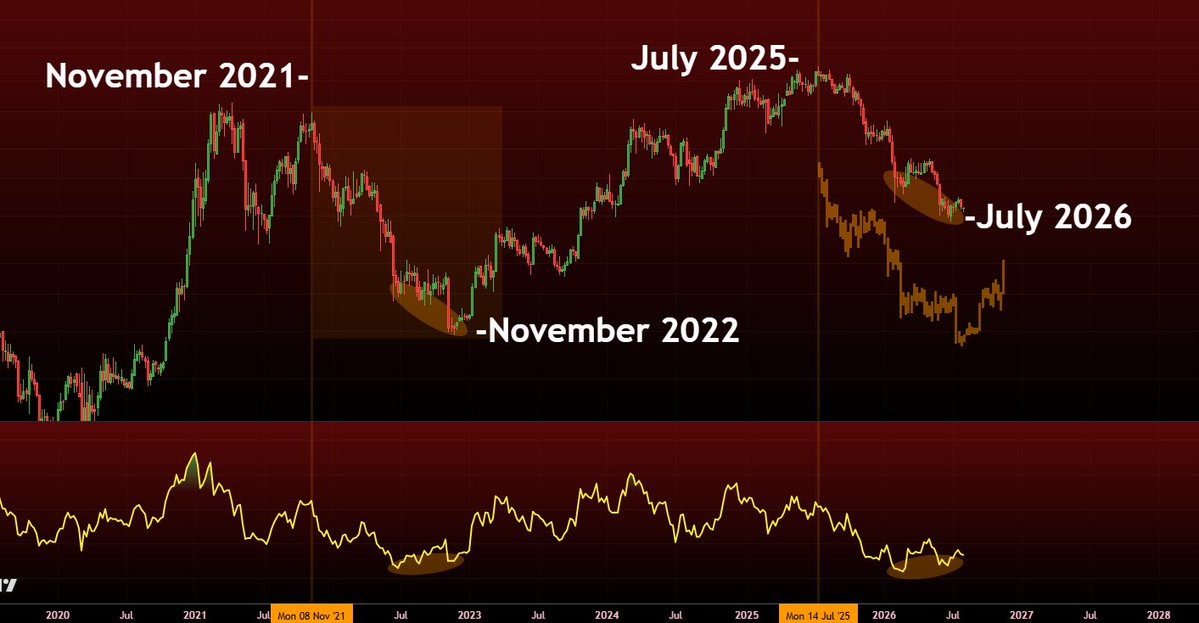
#BTC-S&P500 2022 Fractal
Pretty much played out identically
The top was July 2025 and the bottom would potentially have been July 2026
With the S&P500 closing in on new all time highs and BTC-S&P500 positioned for Bullish Divergence it would suggests its likely bottomed: https://t.co/VY8XN9vtLE
Max Favorable +0.9%Max Adverse −0.1%Opportunity 0.66Time 1.00Magnitude 0.66Score 0.66
MA
𝕏
#Bitcoin structure looks identical to prior bottoms as it sits in max opportunity (Video update)👇
https://t.co/f4AhEw5VIS
Max Favorable +0.3%Max Adverse −1.1%Opportunity 0.28Time 0.50Magnitude 0.28Score 0.25
MA
𝕏
When #BTC does decide to make its first move it will take it to all time highs as it has always sent to the other end of the channel which falls at all time highs currently: https://t.co/3WNoXC8wTn

Max Favorable +0.6%Max Adverse −0.5%Opportunity 0.43Time 0.50Magnitude 0.43Score 0.37
MA
𝕏
#BTC Dominance is in Complacency
When BTC rises over the coming years it will do so alongside Dominance dropping
Completely different dynamics compared to 2018 or 2022 due to Macro Cycle lengthening in time https://t.co/yXbOEq4Trf

Max Favorable +7.0%Max Adverse −2.6%Opportunity 0.66Time 1.00Magnitude 0.66Score 0.64
MA
𝕏
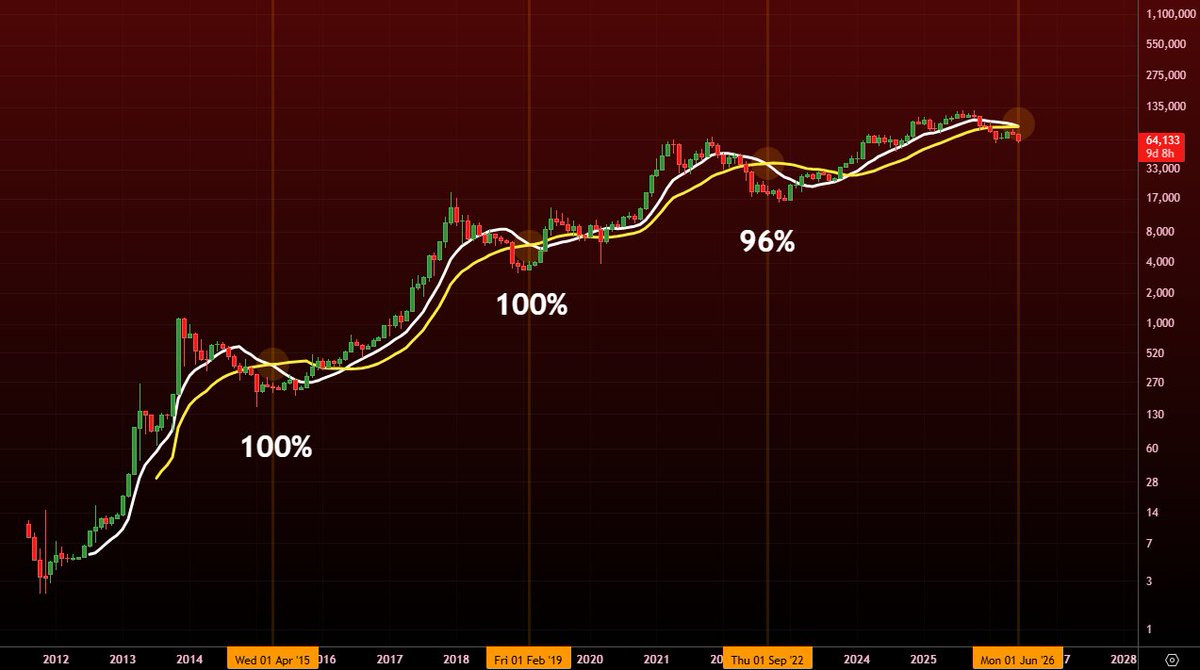
#BTC when this cross has taken place three prior times the drawdown was 96%-100% complete
This next cross will take place on the new monthly candle open in July https://t.co/ZHOsZZ2n1T
Max Favorable +4.3%Max Adverse −9.9%Opportunity 0.27Time 0.19Magnitude 0.27Score 0.24