@cryptorphic1
“@cryptorphic1 sits at 49.9% all-time across 423 calls, improving to 53.2% YTD, with a bullish lean and focus on BTC, ETH, and mid-cap alts like TAO and AAVE. Their clearest edge is in short-term Break/Pump setups, where a concentrated volume of calls and 54.1% short-term accuracy suggest solid momentum-read timing.”
Score Breakdown
| CallRank Score | Move · Path · Time | Scored | |
|---|---|---|---|
| ALL-TIME | 50% | 0.61 · 0.46 · 0.45 | 443 |
| YTD | 51% | 0.61 · 0.48 · 0.48 | 193 |
| 30D | — | — | 0 |
CallRank Score by Duration
Short term54% 210 calls
Medium term46% 183 calls
Long term48% 50 calls
CallRank Score · Last 12 Months
Asset Breakdown — Top 5
| Asset | CallRank Score | Calls | 🟢 Bull · 🔴 Bear |
|---|---|---|---|
| BTC | 49% | 171 | 109 · 62 |
| ETH | 51% | 48 | 26 · 22 |
| TAO | 28% | 8 | 6 · 2 |
| XRP | 56% | 7 | 3 · 4 |
| AAVE | 55% | 7 | 4 · 3 |
Live Calls Summary · By Horizon
@cryptorphic1's active forecasts grouped by horizon and asset. L = Long, S = Short, number = open call count.
Active assets for this forecaster:
| No assets selected | |
|---|---|
| ST | — |
| MT | — |
| LT | — |
ST = Short term · MT = Medium term · LT = Long term
Active Calls · 9 Live
CR
𝕏
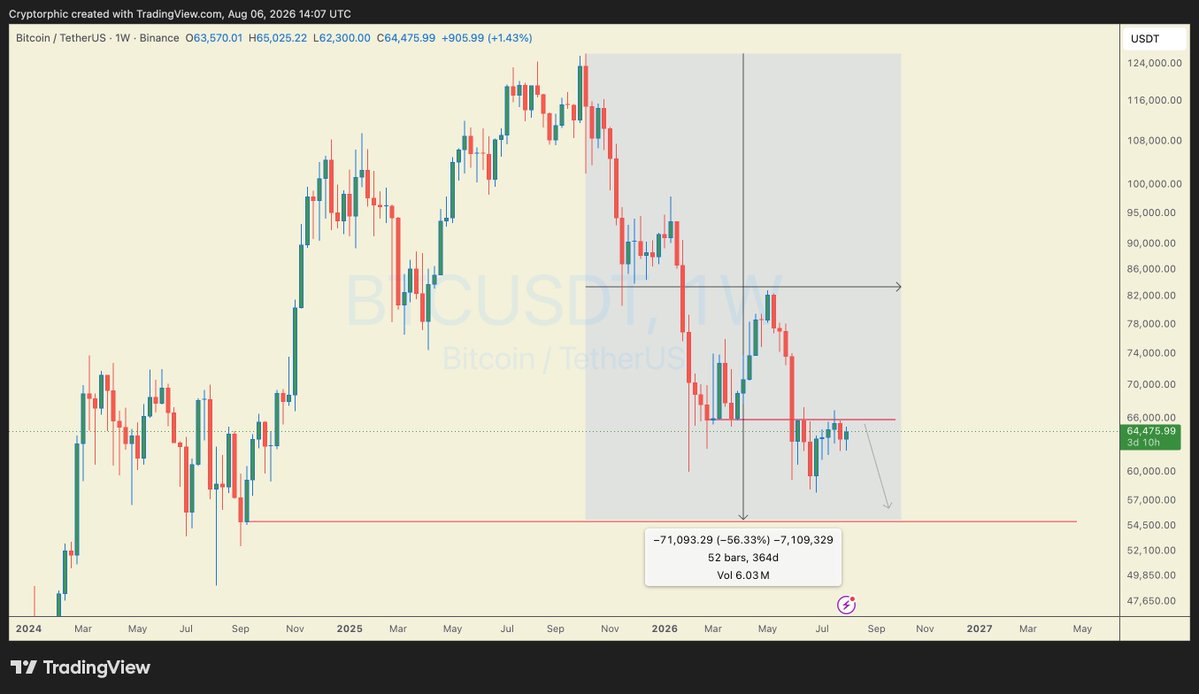
The bear market is not over yet. There's still room to the downside, in my opinion.
bitcoin:native is once again testing a strong weekly resistance after a relief bounce. So far, this level is holding, and I think another rejection from here is still very possible.
If that happens, the next move could be toward the lower horizontal support before we see any real trend reversal.
That's my view. What's your opinion? Let me know in the comments.
PENDING TRIGGER
CR
𝕏
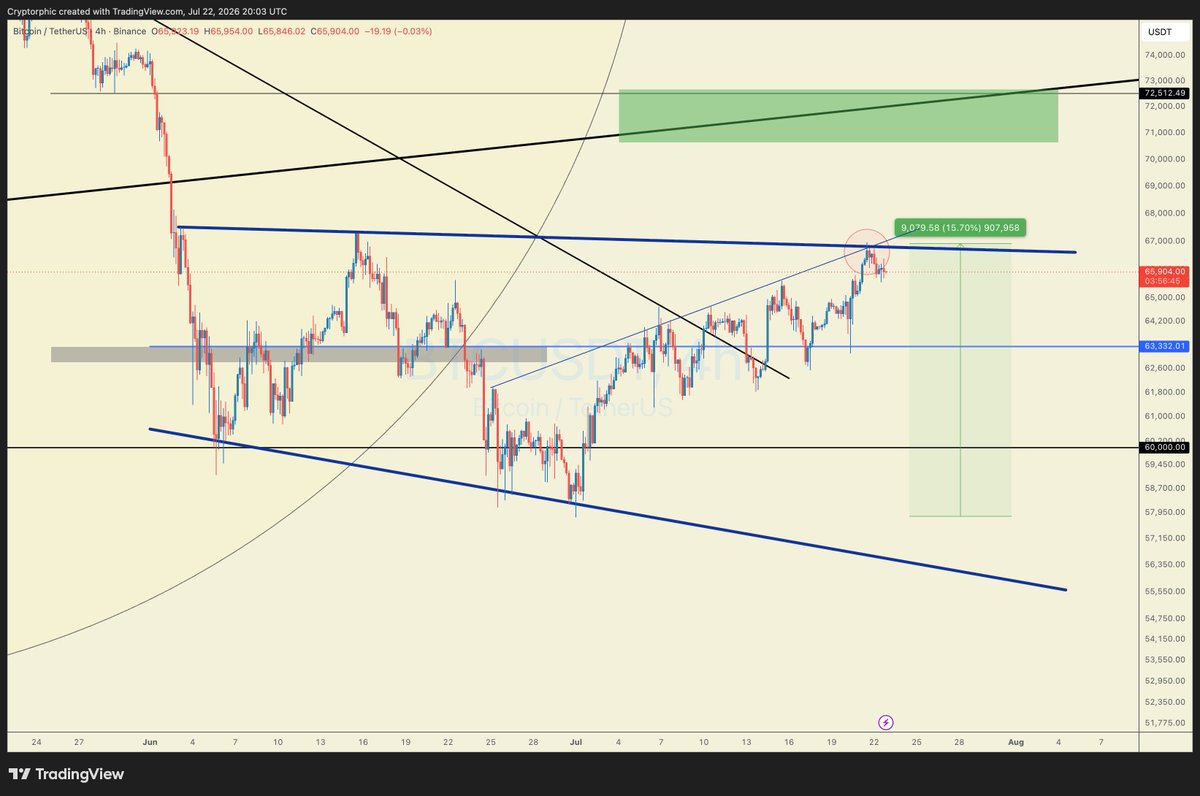
$BTC is up 15% from its recent bottom and is now testing a major resistance zone.
From a technical perspective, Bitcoin could still form a triple bottom before breaking out toward the $82K level over the coming months.
I'll be analysing the entire market structure and sharing an updated Bitcoin chart with fresh data and key insights.
Make sure to bookmark this post and follow me so you don't miss the update.
Cheers!
Max Favorable +0.6%Max Adverse −0.5%ACTIVE
CR
𝕏
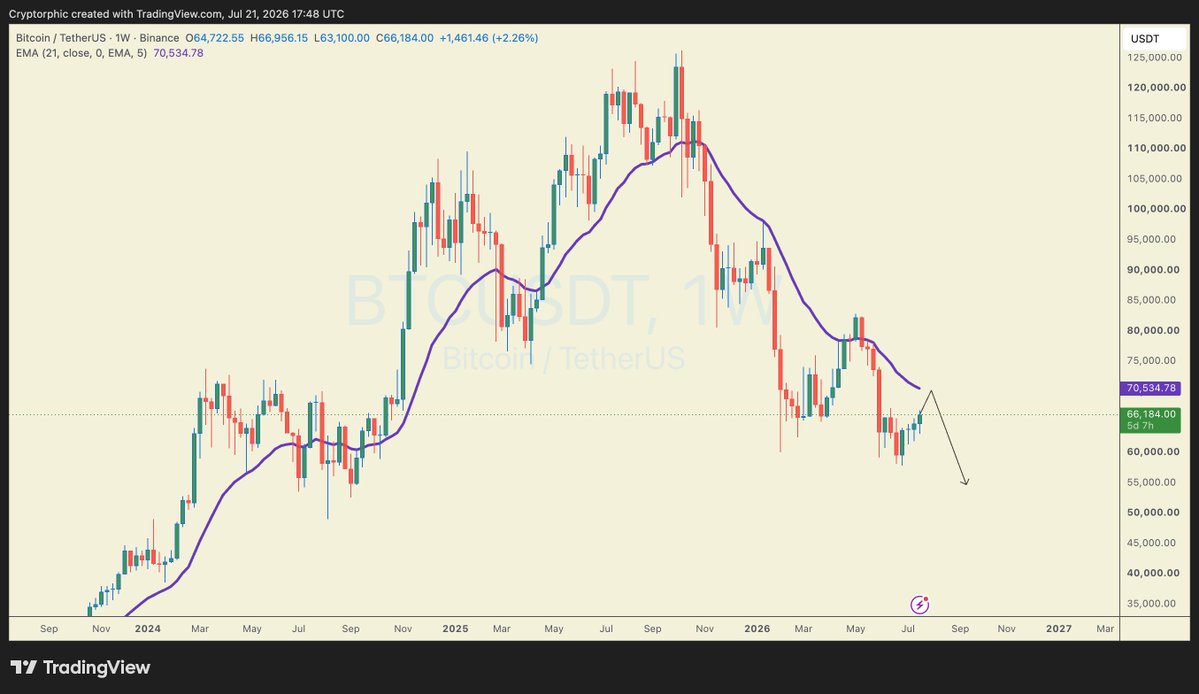
$BTC 1W Update
BTC is now approaching a major resistance zone around $69K–$71K, where the weekly EMA21 is currently sitting.
This is a key area to watch. A strong weekly reclaim above this zone could shift the structure bullish, but rejection here may bring another move lower.
For now, I’m watching how BTC reacts around $69K–$71K.
PENDING TRIGGER
CR
𝕏
$BTC 1W Update
BTC is now approaching a major resistance zone around $69K–$71K, where the weekly EMA21 is currently sitting.
This is a key area to watch. A strong weekly reclaim above this zone could shift the structure bullish, but rejection here may bring another move lower.
For now, I’m watching how BTC reacts around $69K–$71K.
PENDING TRIGGER
CR
𝕏
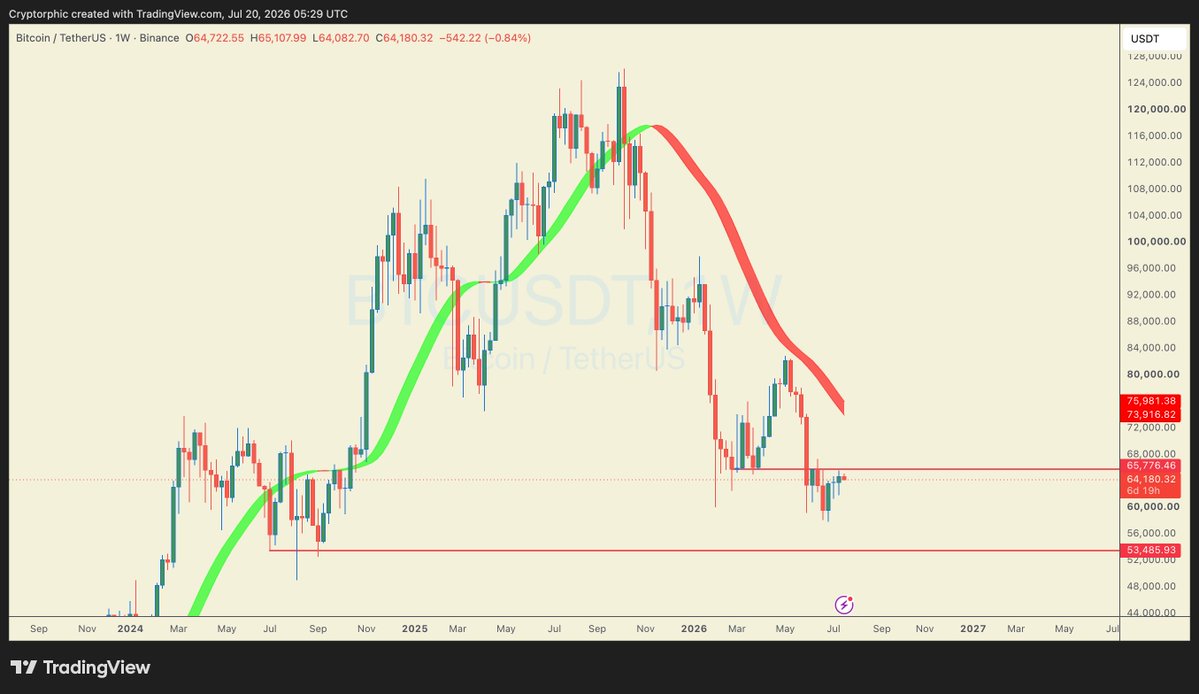
#Bitcoin has now closed three consecutive weekly green candles, but price is still trading below the key weekly resistance at $65,776.
For me, this level remains the line in the sand. Until BTC can reclaim and close above $65.8K on the weekly timeframe, my higher-timeframe bias stays bearish.
A rejection from here could lead to another short-term pullback. That said, I'm not expecting a major move before the monthly candle closes.
PENDING TRIGGER
Scored Calls · Full Audit Trail
CR
𝕏
#XRP has now broken below the lower trendline, confirming the weakness we were watching.
Price is currently attempting a retest of the broken support, which has now flipped into resistance around $1.055-$1.060. If sellers step in here, I expect another leg lower.
As long as XRP stays below this reclaimed zone, the bearish bias remains intact.
A rejection from this retest could send price toward the next support around $1.00-$0.96.
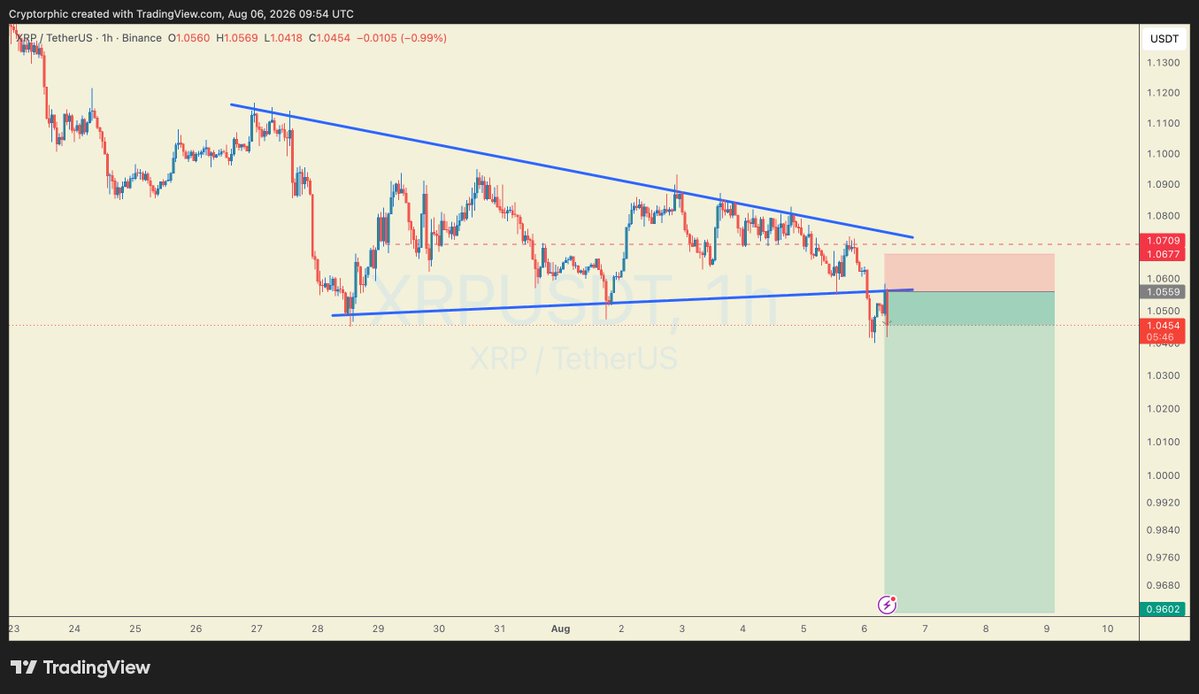
Max Favorable +3.2%Max Adverse −0.7%Opportunity 0.84Time 0.95Magnitude 0.84Score 0.76
CR
𝕏
$BTC Update:
It did exactly what I was expecting, rejected from the upper trendline and started moving lower.
We haven't seen the bounce back toward the entry area I was hoping for, so my short position is only partially filled for now. Still, I’ve opened a small short position as mentioned earlier.
For the risk management, I'm keeping the previous daily candle's high as my SL. If BTC closes a daily candle above that level, I'll consider the setup invalid.
Now watching how price reacts from here.
The breakdown is already in progress, but I’d still like to see further confirmation before adding more to the position.
#Bitcoin
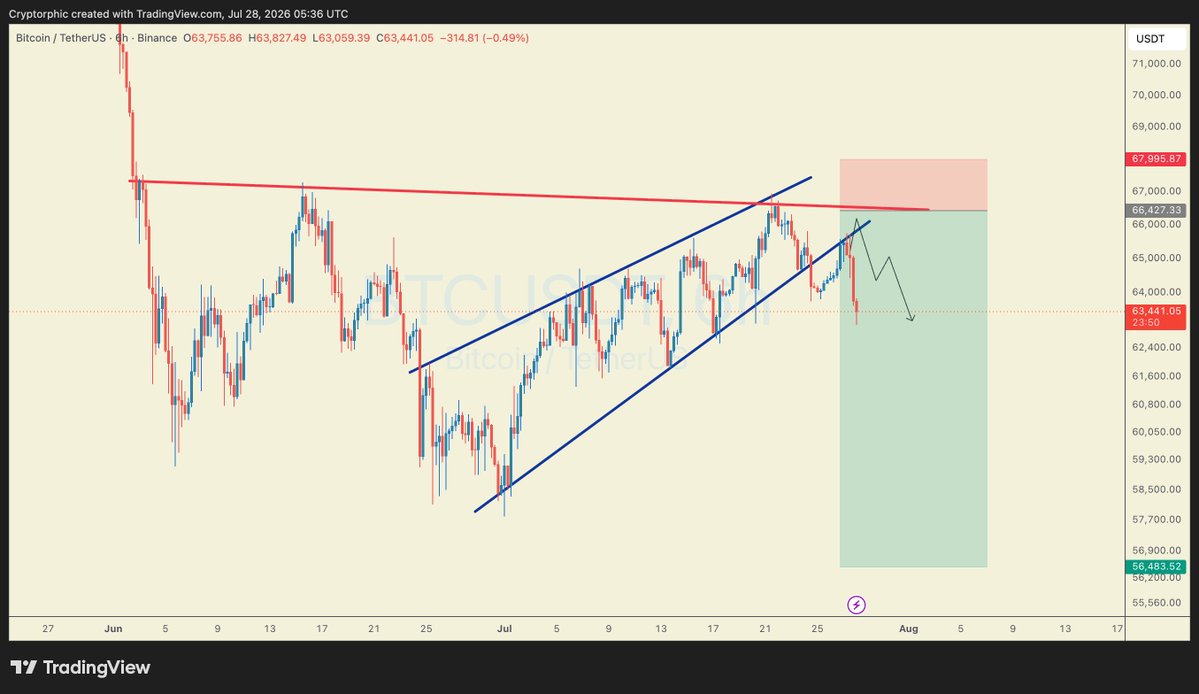
Max Favorable +1.1%Max Adverse −1.0%Opportunity 0.66Time 0.00Magnitude 0.66Score 0.31
CR
𝕏
$LINK is showing strength… but the real move could be down.
Price is now testing the $8.35 support zone while sitting right on the rising trendline and 200 EMA.
Lose this area and the bullish structure starts to break, opening the door toward $7.79 and potentially $7.05.
For now, this looks like a key make-or-break zone.
DYOR, NFA
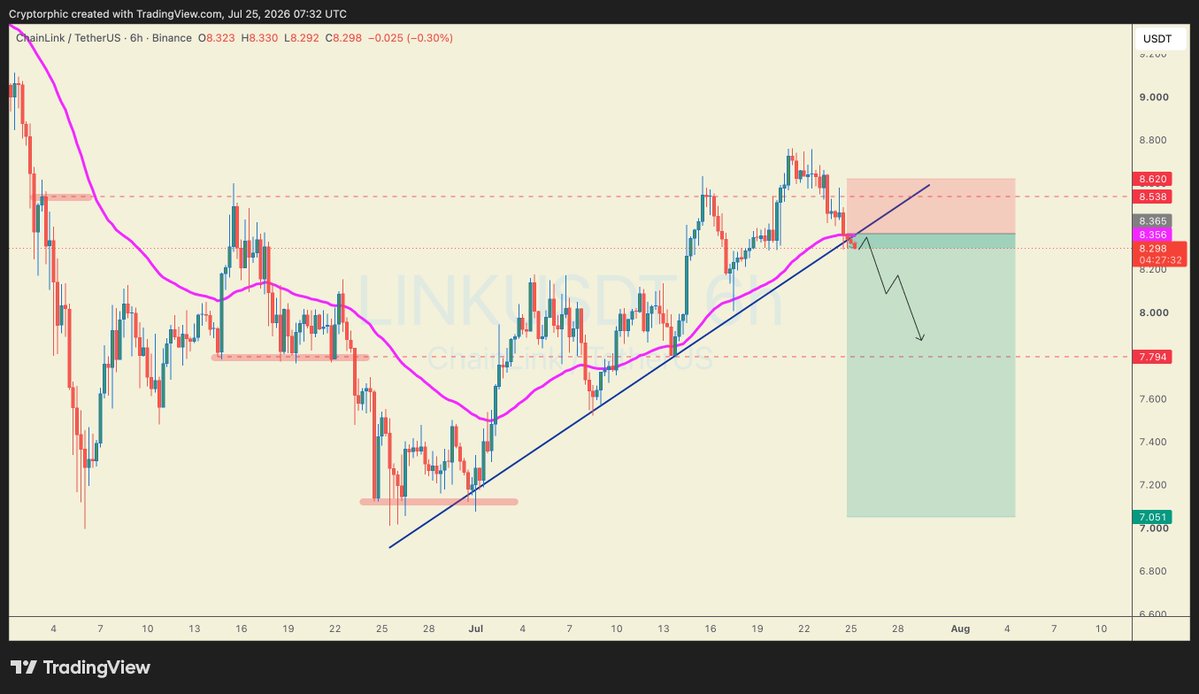
Max Favorable +5.0%Max Adverse −7.4%Opportunity 0.53Time 0.56Magnitude 0.53Score 0.45
CR
𝕏
$SOL is currently squeezing inside a large symmetrical triangle, with price now testing the lower trendline support around $74.
The structure is getting tighter, so I’m expecting a bigger move soon. A clean bounce from this support could send SOL back towards $78–$80, while a breakdown below the trendline could open the door for further downside.
RSI is also sitting near the lower zone, so this is definitely an area to watch closely.
The breakout direction should give us the next clear move.
#SOL
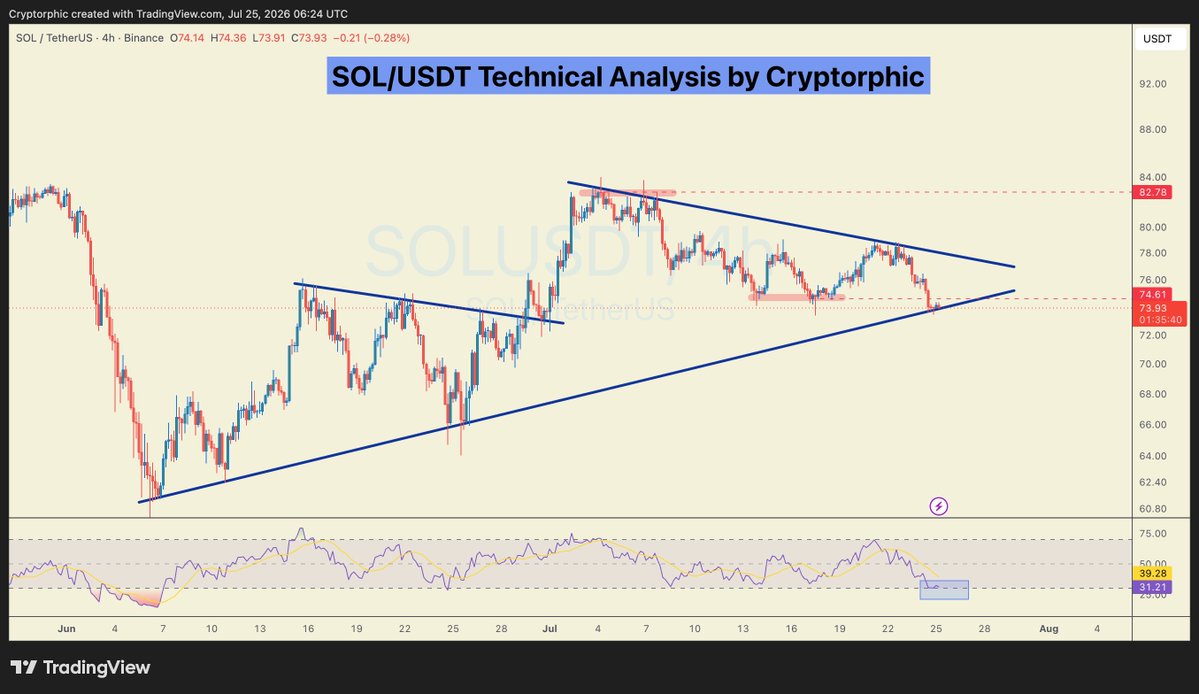
Max Favorable +4.8%Max Adverse −2.2%Opportunity 0.79Time 0.56Magnitude 0.79Score 0.62
CR
𝕏
$INJ USDT Long Setup
Analysis: INJ has broken above the key $4.87 resistance and is now retesting the breakout zone. As long as price holds above this level, the bullish momentum remains intact.
A successful retest could lead to the next leg higher toward our target levels. 🚀
Entry: $4.84 - $4.94
Stop-Loss: $4.51
Take Profits:
TP1 (50%): $5.14
TP2 (30%): $5.39
TP3 (20%): $5.65
Leverage: 7–10x
Risk: 1–2%
#INJ

Max Favorable +3.4%Max Adverse −6.8%Opportunity 0.22Time 0.23Magnitude 0.22Score 0.28