@cryptogirlnova
“@cryptogirlnova is a predominantly bullish forecaster with 53.3% accuracy across 137 calls, specializing in BTC, ETH, and emerging alts like SUI and MNT across mid-term horizons. Her edge lies in short-term and mid-term setups — particularly Wick/Liquidity grabs and Break/Pump calls — where she outperforms her long-term accuracy by a meaningful margin.”
Score Breakdown
| CallRank Score | Move · Path · Time | Scored | |
|---|---|---|---|
| ALL-TIME | 53% | 0.70 · 0.49 · 0.49 | 147 |
| YTD | 42% | 0.67 · 0.36 · 0.37 | 54 |
| 30D | — | — | 0 |
CallRank Score by Duration
Short term56% 11 calls
Medium term60% 69 calls
Long term46% 67 calls
CallRank Score · Last 12 Months
Asset Breakdown — Top 5
| Asset | CallRank Score | Calls | 🟢 Bull · 🔴 Bear |
|---|---|---|---|
| BTC | 56% | 65 | 52 · 13 |
| ETH | 51% | 50 | 49 · 1 |
| MNT | 58% | 8 | 8 · 0 |
| SUI | 60% | 5 | 5 · 0 |
| TAO | 67% | 2 | 2 · 0 |
Live Calls Summary · By Horizon
@cryptogirlnova's active forecasts grouped by horizon and asset. L = Long, S = Short, number = open call count.
Active assets for this forecaster:
| No assets selected | |
|---|---|
| ST | — |
| MT | — |
| LT | — |
ST = Short term · MT = Medium term · LT = Long term
Active Calls · 3 Live
CR
𝕏
Always have a plan.
If you buy Bitcoin here and it still drops to 50-40k, sure your entry could have been better but you will still have some Bitcoin when it goes to 150k+
If you don't buy any Bitcoin and wait until it gets to 50-40k but it never comes you won't own any at all.
Hindsight will always show what the best entry was but you simply don't know before it happens.
Playing multiple outcomes won't provide the highest upside but you will have upside at least.
Max Favorable +2.2%Max Adverse −0.4%ACTIVE
CR
𝕏
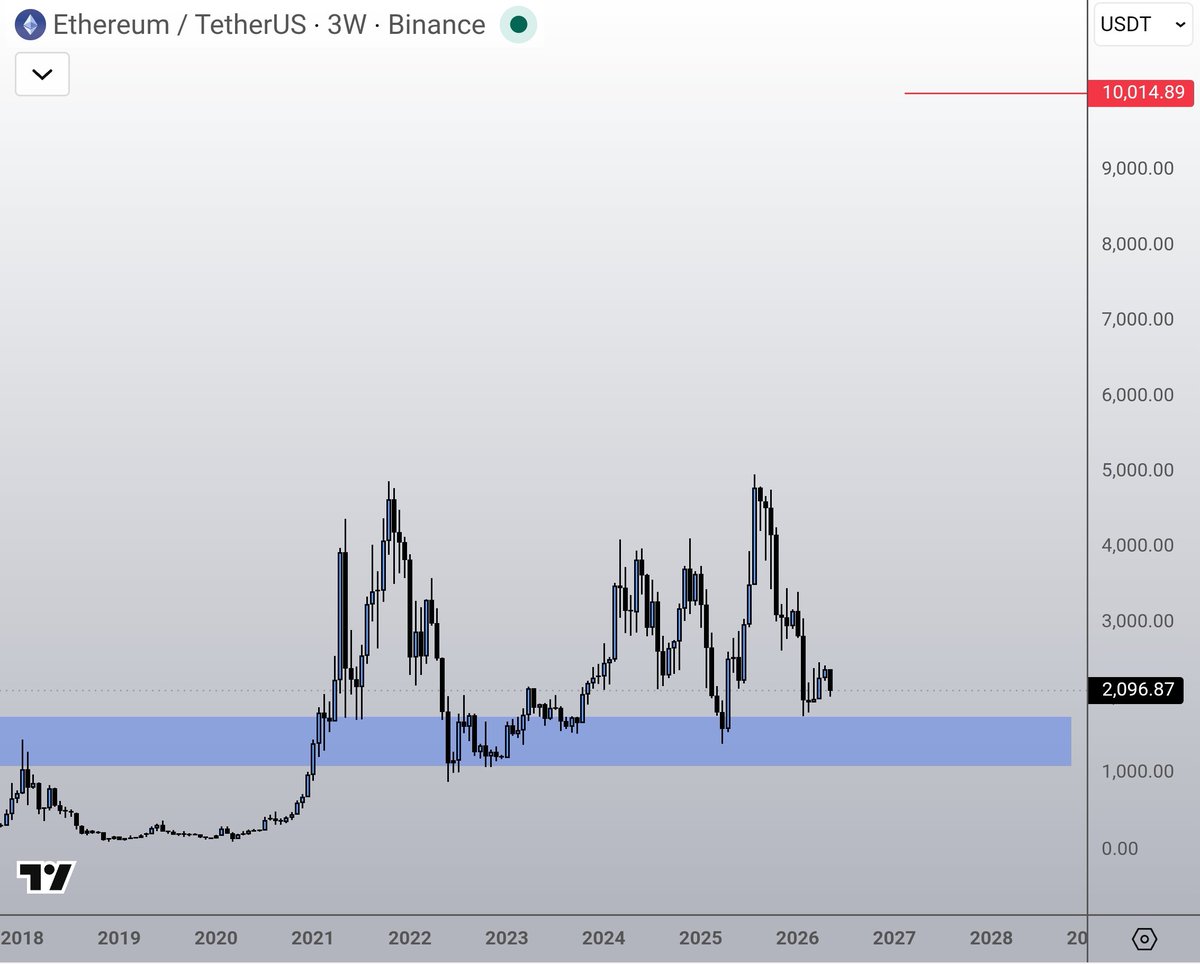
It might not look like it right now, but Ethereum is still extremely likely creating its next bottom formation.
At many points in history did silver, did gold, did ... All take plenty of time before leaving the "station".
"It's not the same"
Well, if you truly believe the crypto space is going nowhere and this is absolutely it I would maybe understand the argument.
But regardless of all the sh*t in this space. The memes, the vapourwere, the rugs etc etc
If we are purely speaking about crypto in general having any future at all.
Then Ethereum effectively stays the silver of our industry.
If Bitcoin is going somewhere, Ethereum will as well.
Max Favorable +0.9%Max Adverse −29.0%ACTIVE
CR
𝕏
While many people will say the altcoin charts have bottomed out or are running flat etc etc.
Truth is while this might technically be correct, that's also no argument yet for a huge reversal.
I see the entire world complaining about gas prices right now, rising electricity costs, not able to afford their rent, hell most are even struggling to just pay their grocery shopping list due to the extremely rising inflation every year lately.
So that must mean their next step is going all into alts right?
Luckily Bitcoin isn't reliant on this as it goes beyond retail right now and can effectively move up in time regardless of how poor we are.
But it's hard to really expect a FULL BLOWN altseason any time soon because of this.
We still have some correlation with Bitcoin going up however. But I don't see that happening really soon either (late this year maybe?).
Locally we can always see some pumps but I think economically quite a lot needs to change to get to levels people really dream off.

Max Favorable +24.0%Max Adverse −13.5%ACTIVE
Scored Calls · Full Audit Trail
CR
𝕏
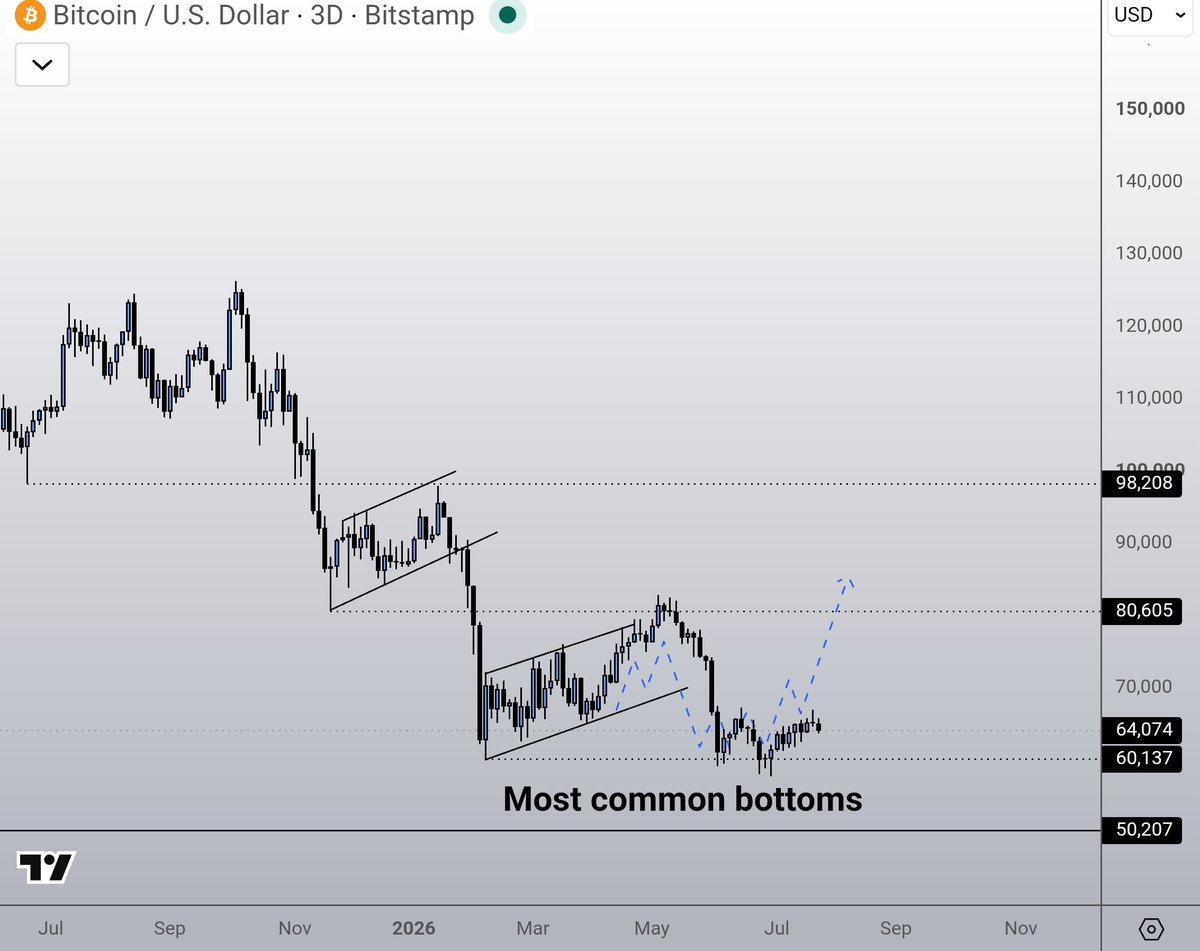
Can't find my original post anymore with an earlier version of today's chart but going a few months back I repeatedly emphasised that bottoms do NOT often V-shape recover.
Very very rarely that happens and bottoms usually look like this 👇
Fast forward to today and that chart has for the most part (slightly to my own surprise) almost entirely followed to pattern.
It's to early to claim victory on this one however. While price is following that usual pattern, we aren't at the push up phase yet.
Meaning it's to soon to call the bottom is in yet as price hasn't made its up move yet like in the chart I drew below.
But would be legendary in hindsight if it did despite the confirmation not being there yet as of today.
Still following it great so far though.
Max Favorable +2.4%Max Adverse −2.3%Opportunity 0.55Time 0.67Magnitude 0.55Score 0.45
CR
𝕏
Probably to soon but I'll take anything we get these days.
ETH season incoming! 😌 https://t.co/UbmLI3PMZu

Max Favorable +1.3%Max Adverse −0.6%Opportunity 0.56Time 1.00Magnitude 0.56Score 0.57
CR
𝕏
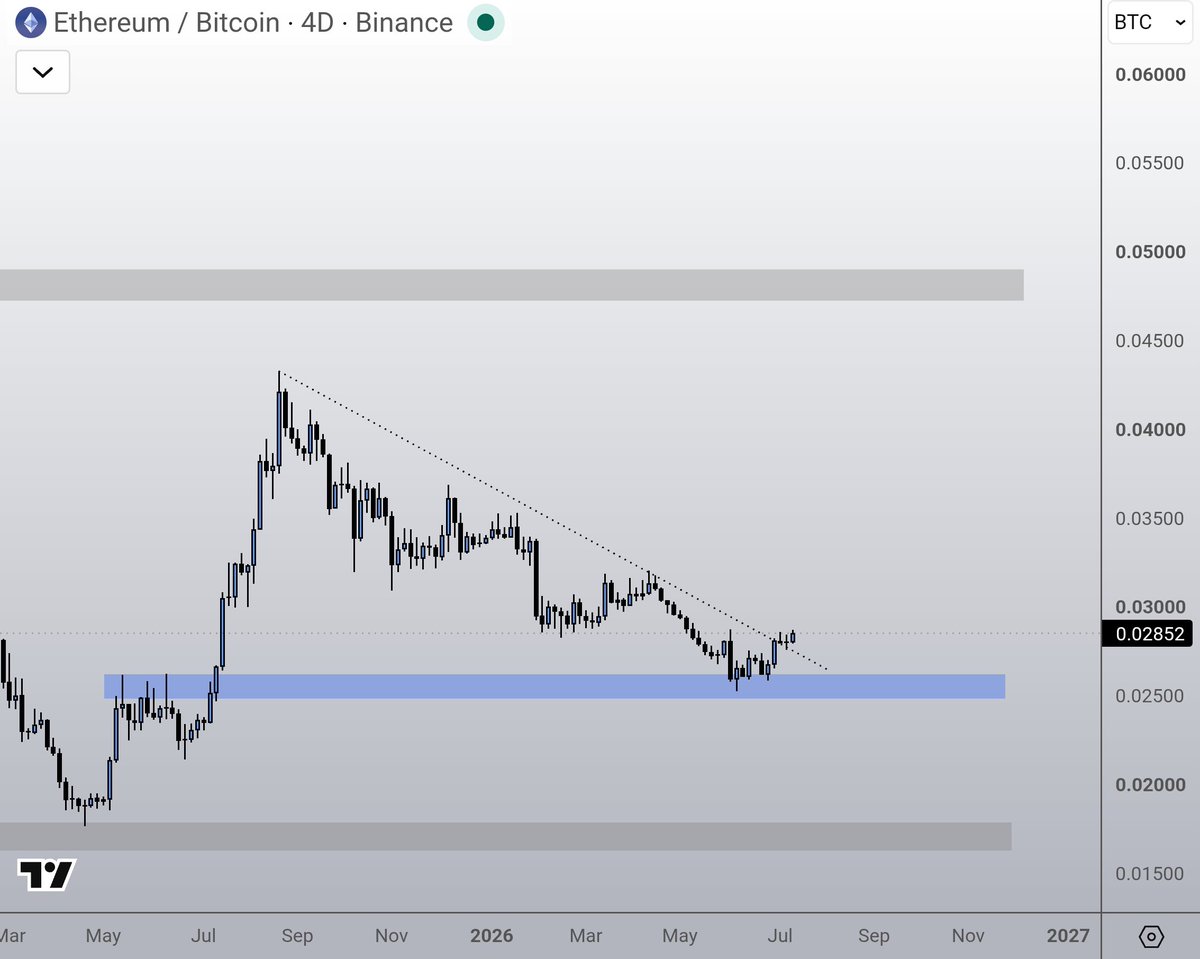
The main thesis that makes Ethereum more interesting vs Bitcoin at certain times is the outperformance window.
Bitcoin is the golden standard. Ethereum is a close second.
BUT Ethereum right now will go quicker to $4-5k (2.5x) than Bitcoin will go to $150k (2.5x).
It ain't about which one is best or which one will go up right now.
They will likely BOTH go up simultaneously. But one will outperform the other and give quicker gains at certain time frames.
Bitcoin has been the one doing that for quite a while now.
Now it will be Ethereum again.
Max Favorable +6.2%Max Adverse −0.1%Opportunity 0.95Time 1.00Magnitude 0.95Score 0.80
CR
𝕏
The main thesis that makes Ethereum more interesting vs Bitcoin at certain times is the outperformance window.
Bitcoin is the golden standard. Ethereum is a close second.
BUT Ethereum right now will go quicker to $4-5k (2.5x) than Bitcoin will go to $150k (2.5x).
It ain't about which one is best or which one will go up right now.
They will likely BOTH go up simultaneously. But one will outperform the other and give quicker gains at certain time frames.
Bitcoin has been the one doing that for quite a while now.
Now it will be Ethereum again.
Max Favorable +4.1%Max Adverse −0.0%Opportunity 0.92Time 1.00Magnitude 0.92Score 0.77
CR
𝕏
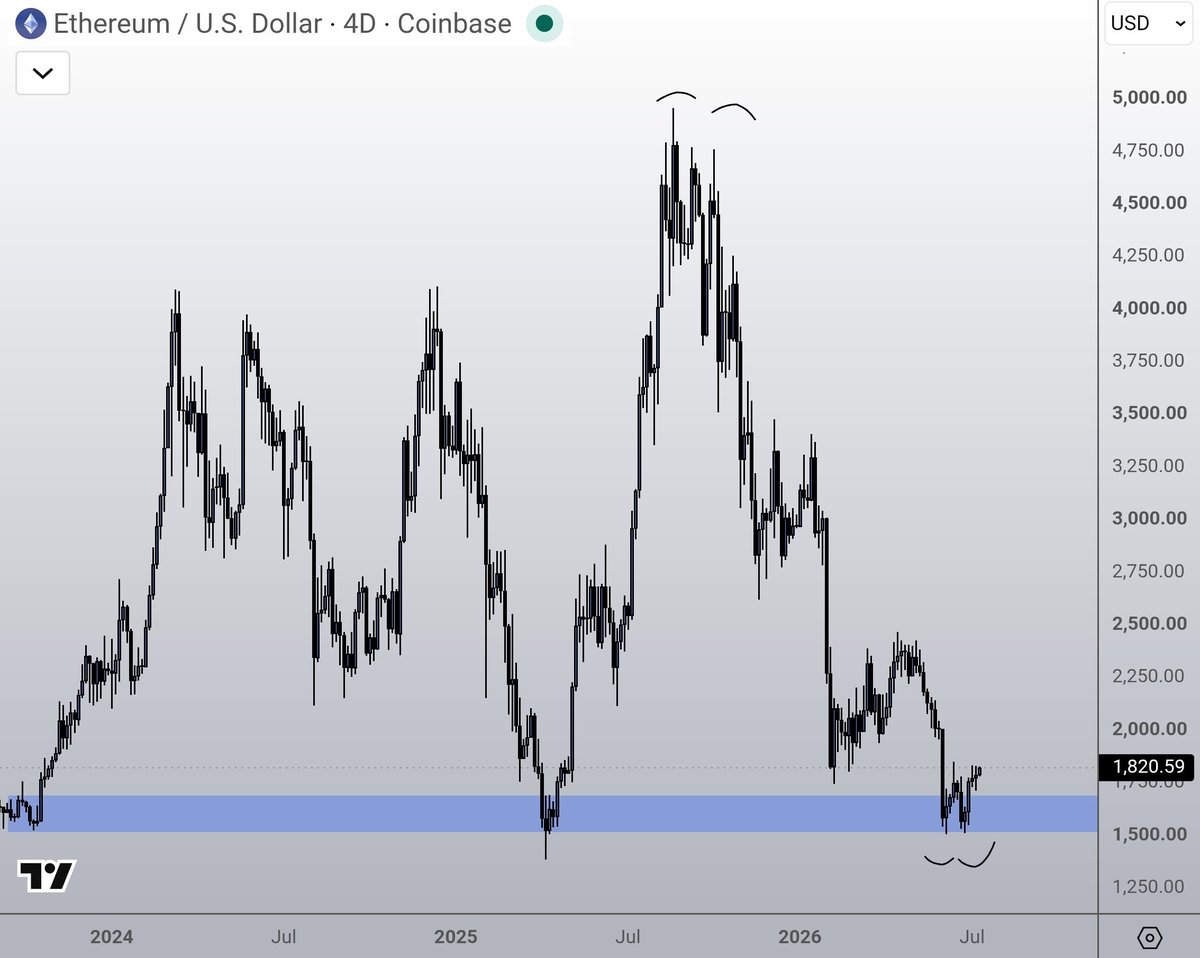
At the exact equal range lows it ain't a bad local pattern imo.
Reversals often begin with some sort of W shape pattern.
Especially with confluence at strong support.
Ethereum's biggest next new upgrade since the merge happening in the second half of 2026 will likely also not be a coincidence in hindsight looking at the price action by then.
Max Favorable +8.8%Max Adverse −3.9%Opportunity 0.56Time 1.00Magnitude 0.56Score 0.62