@calebfranzen
“@calebfranzen holds a 48.5% all-time accuracy across 394 calls, with a stronger 53.4% YTD, focusing on BTC, ETH, SOL, XRP, and LINK with a heavily bullish lean. Their edge lies in Break/Pump setups, their most-used call type, where their short-term calls show the best accuracy of any timeframe they cover.”
Score Breakdown
| CallRank Score | Move · Path · Time | Scored | |
|---|---|---|---|
| ALL-TIME | 49% | 0.65 · 0.47 · 0.45 | 407 |
| YTD | 48% | 0.63 · 0.48 · 0.48 | 89 |
| 30D | — | — | 0 |
CallRank Score by Duration
Short term52% 112 calls
Medium term48% 263 calls
Long term44% 32 calls
CallRank Score · Last 12 Months
Asset Breakdown — Top 5
| Asset | CallRank Score | Calls | 🟢 Bull · 🔴 Bear |
|---|---|---|---|
| BTC | 47% | 366 | 260 · 106 |
| ETH | 51% | 14 | 11 · 3 |
| XRP | 49% | 3 | 2 · 1 |
| SOL | 48% | 3 | 2 · 1 |
| LINK | 82% | 2 | 1 · 1 |
Live Calls Summary · By Horizon
@calebfranzen's active forecasts grouped by horizon and asset. L = Long, S = Short, number = open call count.
Active assets for this forecaster:
| No assets selected | |
|---|---|
| ST | — |
| MT | — |
| LT | — |
ST = Short term · MT = Medium term · LT = Long term
Active Calls · 2 Live
CA
𝕏
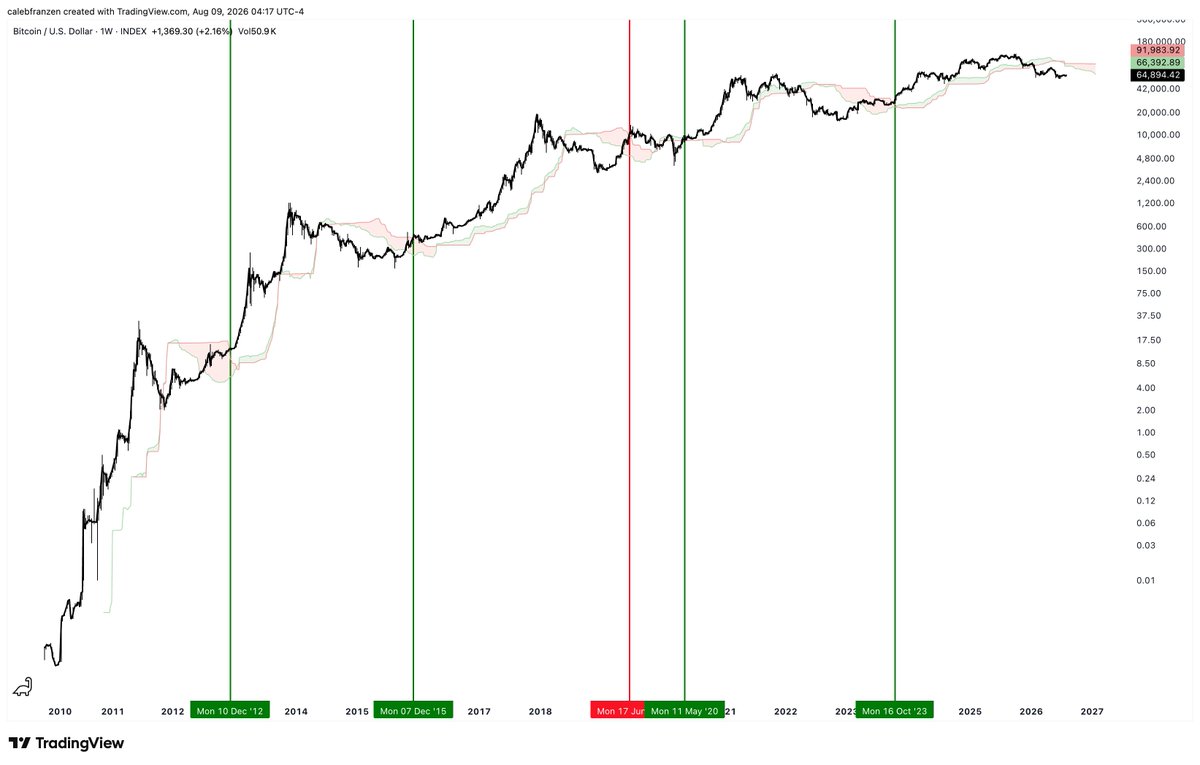
Want to be bullish on Bitcoin?
Just wait for price to break above the weekly Ichimoku cloud.
80% of signals perfectly marked the start of a sustained bull market.
2019 is the only exception.
You don't need to buy the bottom. You just need to own the bull.
Hasn't flashed yet. https://t.co/BohoppGyLy
PENDING TRIGGER
CA
𝕏
More than a week ago, I transferred a significant amount of cash into my crypto brokerage account.
I haven't made any purchases w/ that capital yet, but the significance of this is clear:
Not only am I prepared to buy buy the remaining 80% of what I sold in Nov.'25 at $97k, but I'm also planning to allocate even more capital to gain even more BTC exposure than I've ever had before.
Yes, this is a bear market.
No, I don't know how long Bitcoin will stay in this bear market.
No, I don't know how low Bitcoin's price will go in this bear market.
All I know is what I can quantifiably prove.
And I can prove, in a myriad of ways, that Bitcoin has flashed several independent accumulation signals on various long-term timeframes.
I'm still waiting for one more accumulation signal to flash.
I've kept premium members up to date with all of them that have flashed, and even told them to watch for them BEFORE they flashed.
I literally Babe Ruth'd that shit.
So, right now, I believe that it's permissible for me to buy Bitcoin at/near/below these current levels, based on my own personal convictions, my time horizons, my risk appetite, my liabilities, etc., etc.
Is it permissible for you?
How would I know.
I can only tell you what I'm doing, why, and show you the data to support my actions.
Just like when I told investors that I was selling at $97k.
Since February 2025, I told people the exact conditions that would force me to flip bearish and how I would react in that environment.
Then the signal flashed and I sold.
I never told anyone else to sell.
So I'm not going to tell you to buy here either.
I'll only tell you that I'm a buyer, even if I suspect that there's a good chance for prices to fall lower in the short-term.
Over the next 2, 3, 5, + years, I'm not worried at all.
I have income.
I have a large asset base.
And I want to accumulate more assets.
Being an investor quite literally means that you risk getting poorer in the short-term while withstanding volatility and market pressure.
It's what we sign up for.
If you aren't prepared for that (and how to handle it properly), then you're in the wrong game.
Premium members of Cubic Analytics know exactly what I'm looking for next in order to make my biggest purchases ever.
If you aren't one of them, it's time to click the link in my bio and actually join the team so that you have the access to my plans.
Lock in, embrace nuance, and good luck.
Max Favorable +21.2%Max Adverse −15.4%ACTIVE
Scored Calls · Full Audit Trail
CA
𝕏
Both of these statements are true:
1. I think Bitcoin will make new lows.
2. I will make my most aggressive buys below $61k.
Max Favorable +0.4%Max Adverse −0.1%Opportunity 0.45Time 1.00Magnitude 0.45Score 0.59
CA
𝕏
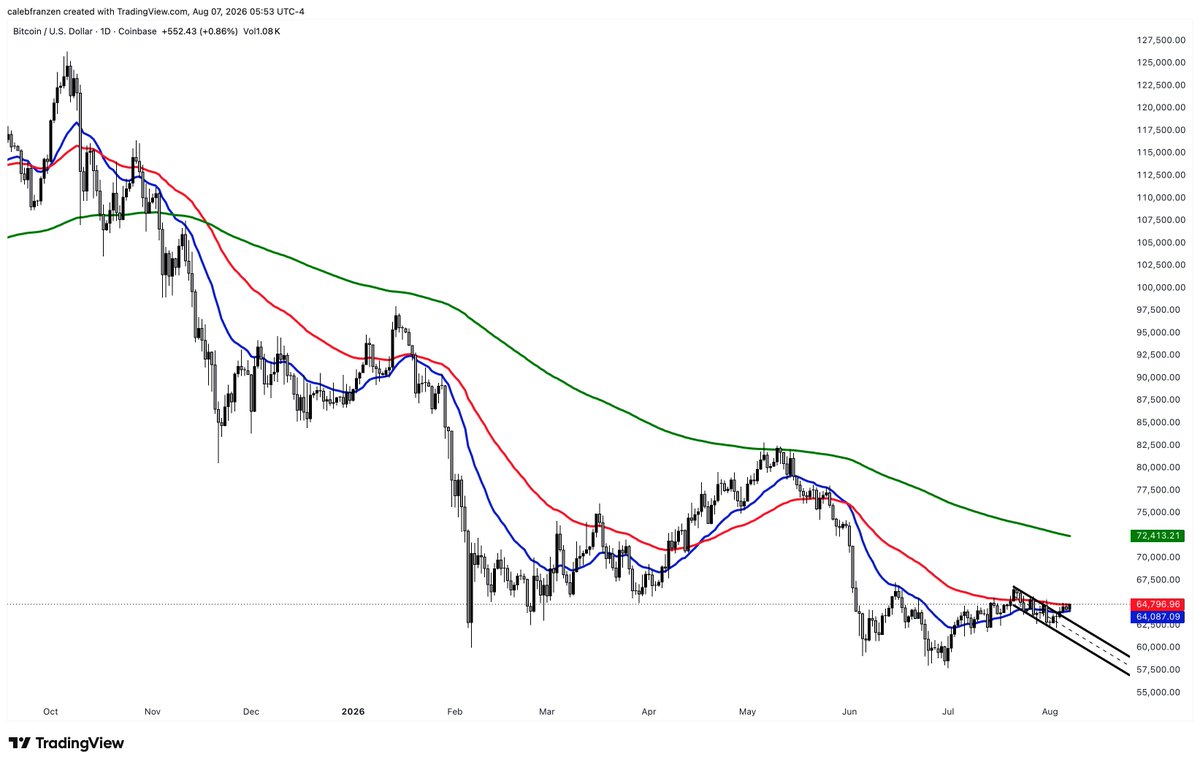
Here's the thing...
Bitcoin looks quite good here as it tries to reclaim its 55-day EMA (red).
I've been calling for a relief rally for quite some time and it keeps taking much longer than I've expected, with each attempt fading.
I'm targeting the 200-day EMA (green).
But...
When I first shared that relief rally target, it was around $76k.
Today, it's $72k.
By definition, this means that upside today is quite limited.
Currently +12% implied upside.
I don't think any of us are going to get excited by that.
What should get us excited?
The opportunity to retest the 200-day EMA, break above it, and flip it into support for a potential bullish trend reversal.
That's what I'm hoping to see.
But a lot of work needs to happen between now and then.
Embrace nuance.
Max Favorable +0.9%Max Adverse −0.5%Opportunity 0.67Time 1.00Magnitude 0.67Score 0.59
CA
𝕏
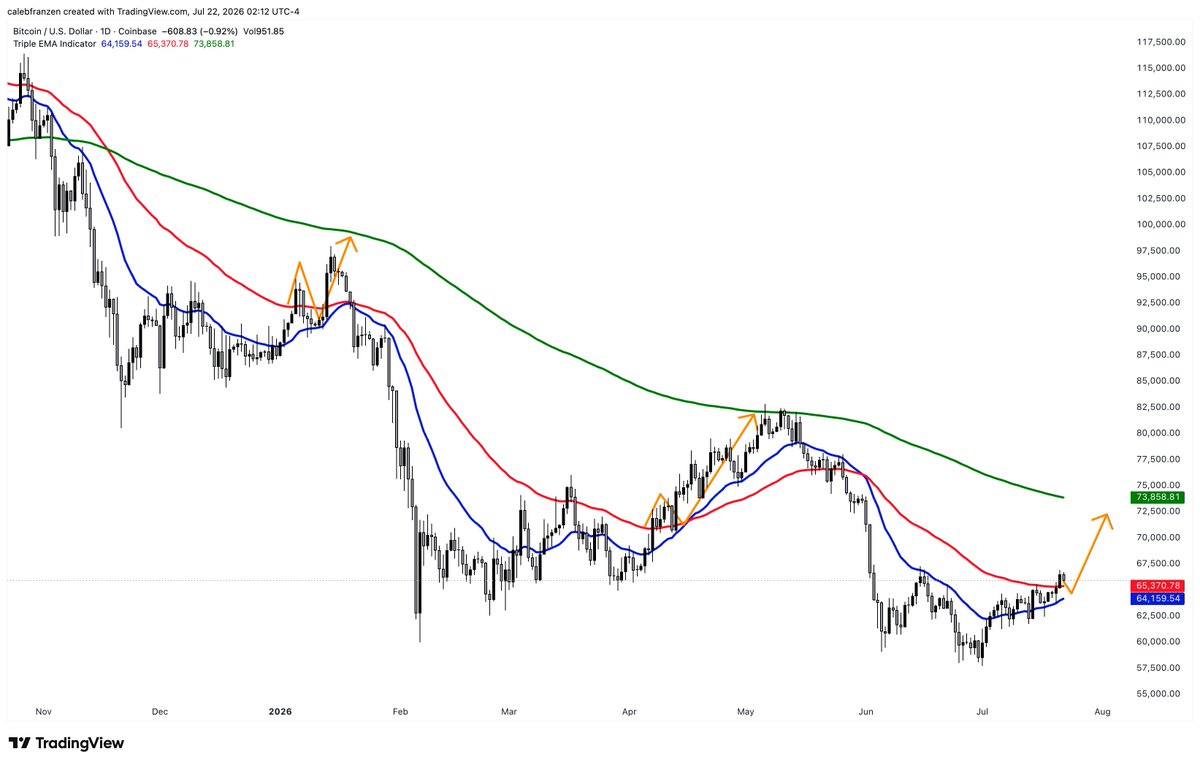
It's the same setup we've seen over the course of this bear market.
Relief rally breaks above the 21 & 55-day EMAs.
Flip them into support.
Continuation towards the 200-day EMA.
It will work... until it doesn't. https://t.co/1UoHCDrHtG
Max Favorable +0.8%Max Adverse −0.5%Opportunity 0.44Time 0.50Magnitude 0.44Score 0.40
CA
𝕏
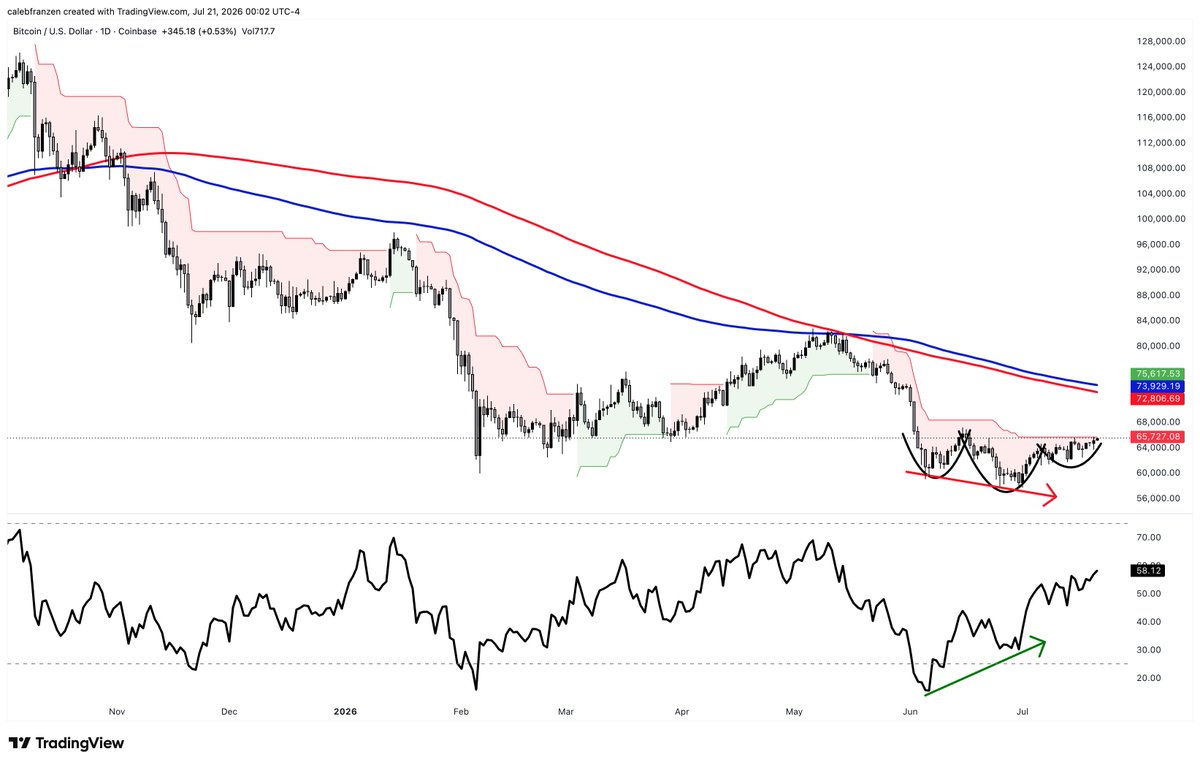
Relief rally to $74k (200-day MA cloud) & then re-evaluate. https://t.co/oKclouvk0V
Max Favorable +2.1%Max Adverse −0.2%Opportunity 0.77Time 1.00Magnitude 0.77Score 0.69
CA
𝕏
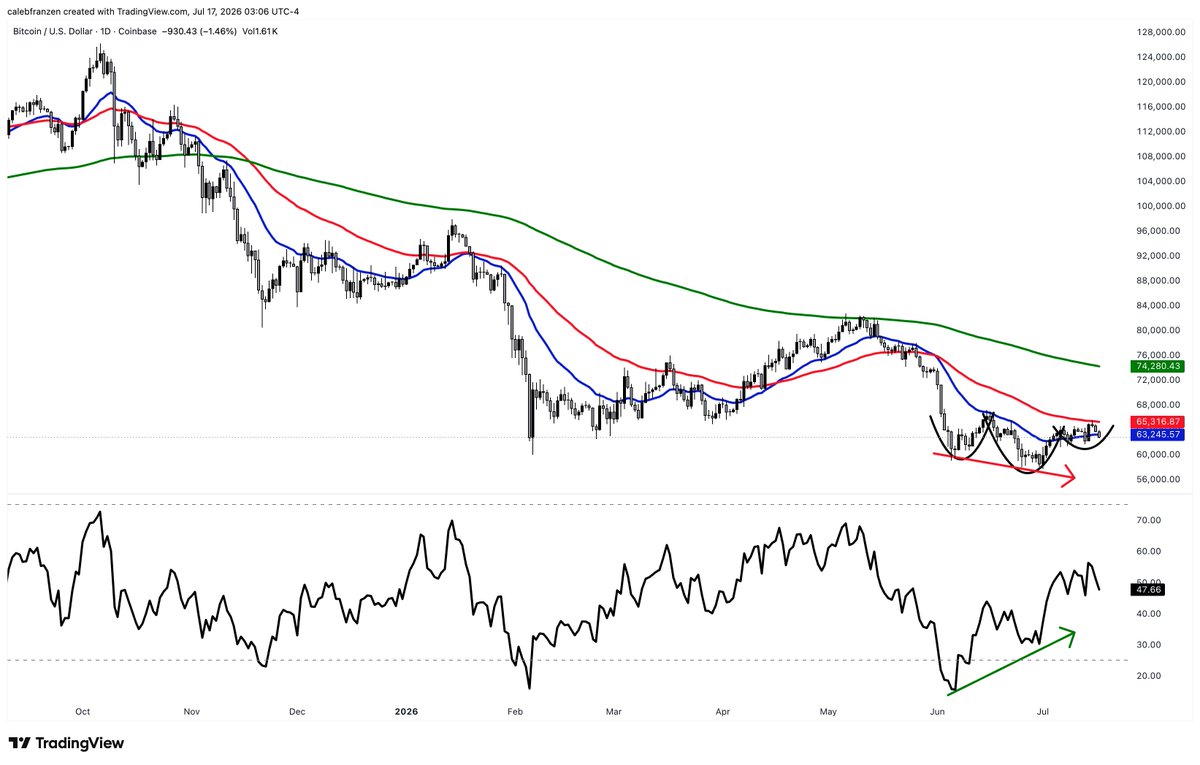
Bitcoin is back below its:
🔵 21-day EMA
🔴 55-day EMA
🟢 200-day EMA
All of these moving averages have a negative slope.
The H&S setup that I shared a few days ago is now invalid so long as price is below the 21 & 55-day EMAs.
Might sweep the lows of the bullish RSI div. https://t.co/dmsAlDEbYL
Max Favorable +0.6%Max Adverse −2.4%Opportunity 0.40Time 0.00Magnitude 0.40Score 0.16