@Trader_XO
“@Trader_XO has a 46.8% all-time accuracy across 53 calls, focusing on BTC, ETH, and mid-cap alts like SOL, SUI, and TAO with a balanced long/short approach. Their strongest edge is in long-term calls (66.7% accuracy) and wick/liquidity grab setups, which make up nearly a third of their call volume.”
Score Breakdown
| CallRank Score | Move · Path · Time | Scored | |
|---|---|---|---|
| ALL-TIME | 47% | 0.62 · 0.45 · 0.43 | 55 |
| YTD | 59% | 0.62 · 0.61 · 0.65 | 7 |
| 30D | — | — | 0 |
CallRank Score by Duration
Short term55% 8 calls
Medium term43% 40 calls
Long term67% 7 calls
CallRank Score · Last 12 Months
Asset Breakdown — Top 5
| Asset | CallRank Score | Calls | 🟢 Bull · 🔴 Bear |
|---|---|---|---|
| BTC | 49% | 34 | 20 · 14 |
| ETH | 51% | 8 | 6 · 2 |
| SOL | 37% | 6 | 2 · 4 |
| SUI | 47% | 2 | 1 · 1 |
| XRP | 67% | 1 | 0 · 1 |
Live Calls Summary · By Horizon
@Trader_XO's active forecasts grouped by horizon and asset. L = Long, S = Short, number = open call count.
Active assets for this forecaster:
| No assets selected | |
|---|---|
| ST | — |
| MT | — |
| LT | — |
ST = Short term · MT = Medium term · LT = Long term
Active Calls · 1 Live
TR
𝕏
$BTC
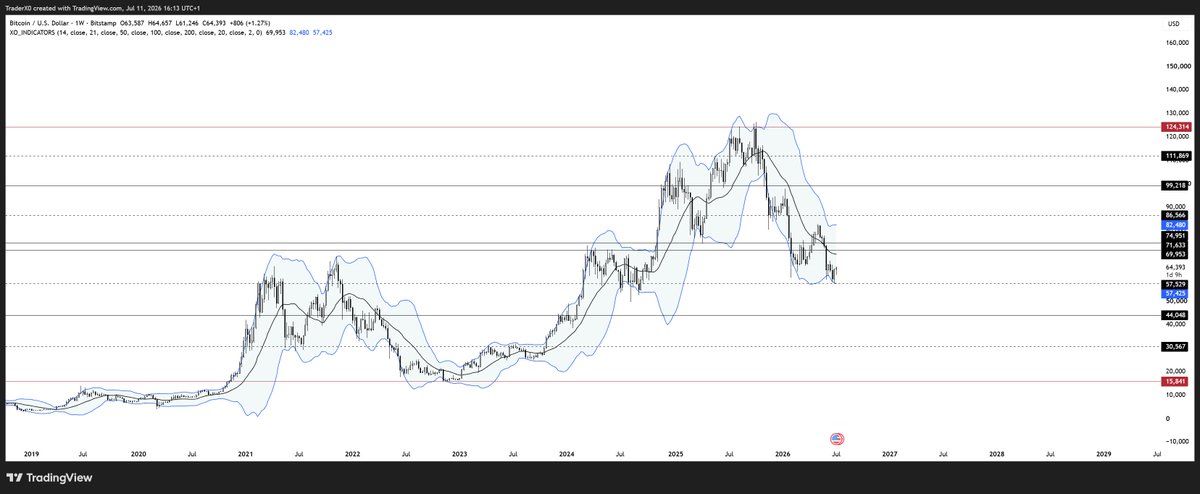
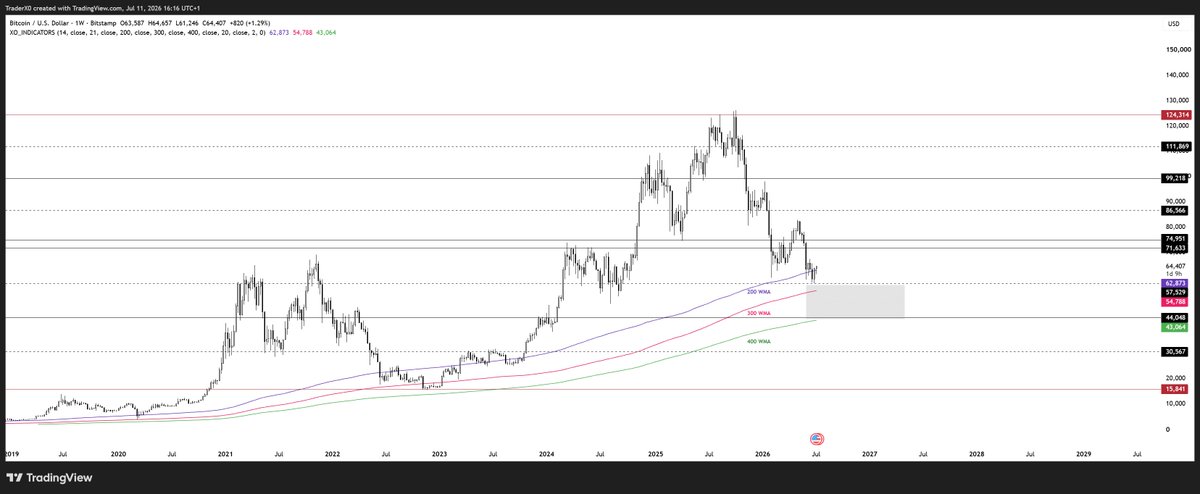
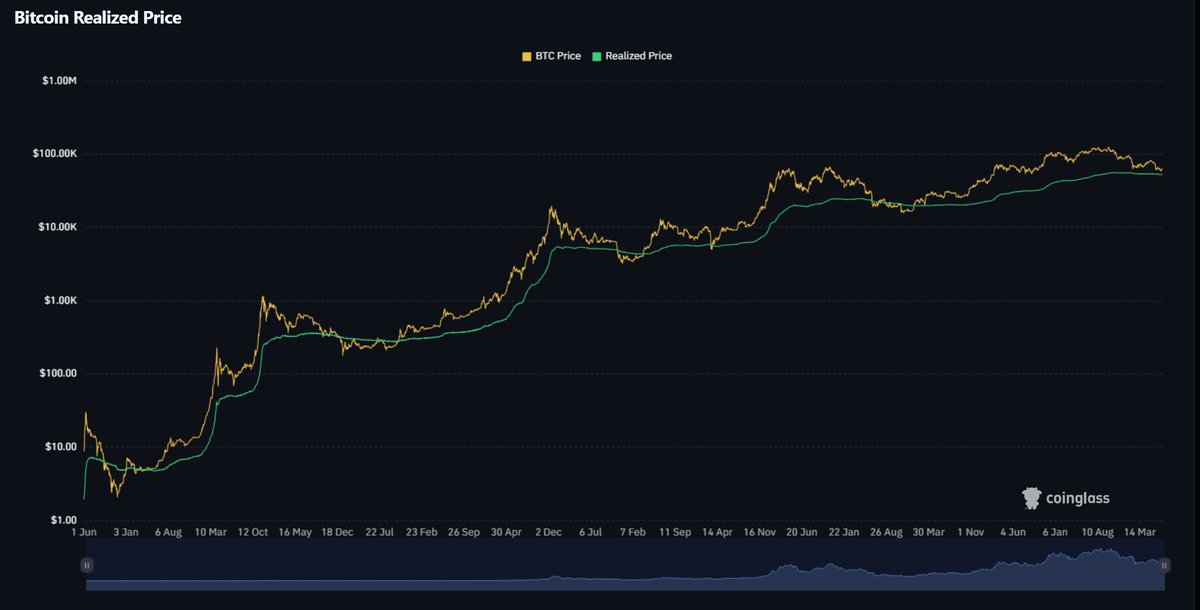
Higher Time Frame
Having shorted this move from the 125s, I personally see little value in continuing to press swing shorts at these levels.
My focus has shifted back toward spot accumulation, where I believe the more attractive asymmetric play lies in identifying high-quality buying opportunities for the longer-term move over the next several quarters.

Max Favorable +0.1%Max Adverse −1.1%ACTIVE
Scored Calls · Full Audit Trail
TR
𝕏
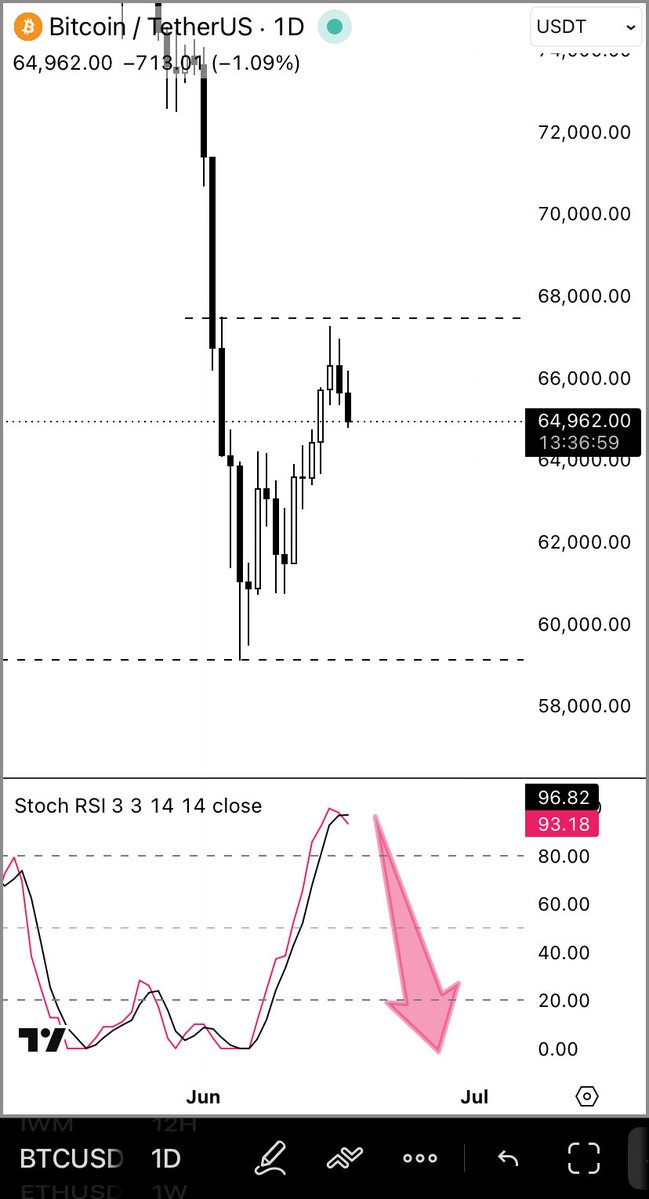
67-68s local range highs imo
Leaning towards price eventually revisiting 60-62k for a rotation down….
If a push to 71s comes first then that’s a big level I’d sell… https://t.co/X4go8Wtxbt
Max Favorable +8.0%Max Adverse −6.8%Opportunity 0.47Time 0.71Magnitude 0.47Score 0.52
TR
𝕏
67-68s local range highs imo
Leaning towards price eventually revisiting 60-62k for a rotation down….
If a push to 71s comes first then that’s a big level I’d sell… https://t.co/X4go8Wtxbt
Max Favorable +11.0%Max Adverse −2.3%Opportunity 0.71Time 0.97Magnitude 0.71Score 0.74
TR
𝕏
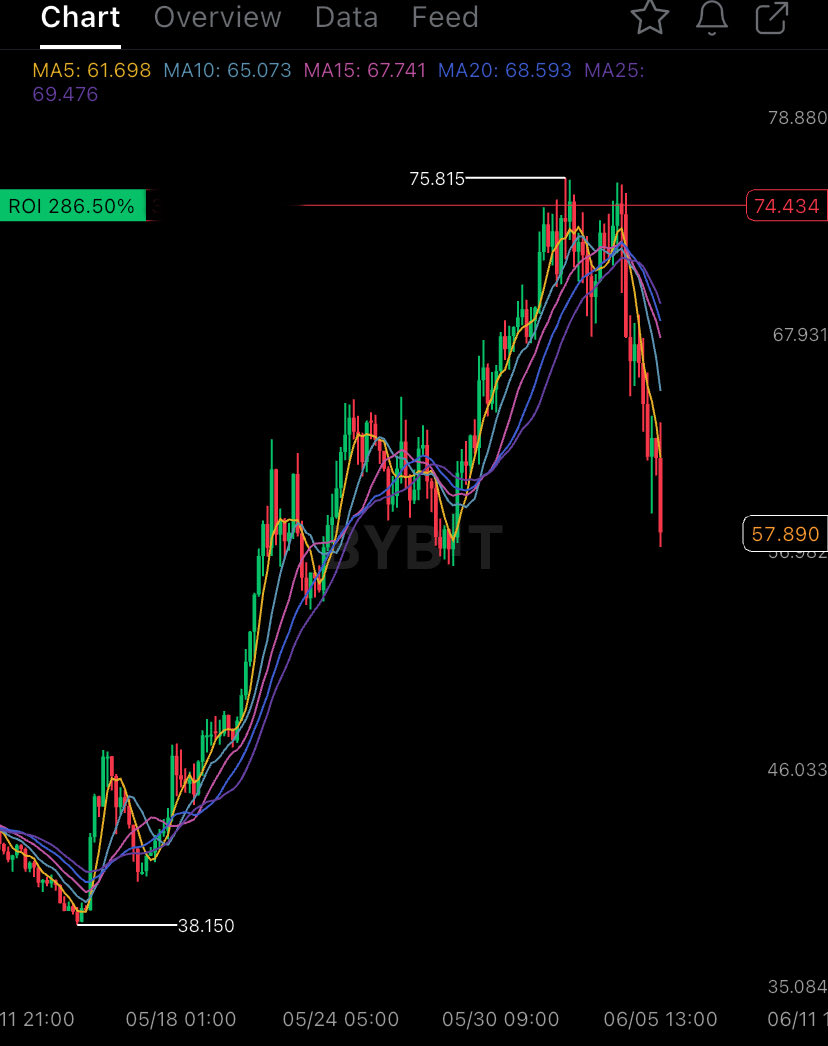
‘You don’t short the strongest asset’
Well you do when it’s at a key distributive inflection point and the asymmetry is there… not the confirmation
The ones giving bad trading advice probably can’t short…. Maybe…
Once again…. This goes back towards buying a stack of spot hype and into cold storage when I’ve finished…
Max Favorable +8.9%Max Adverse −33.1%Opportunity 0.49Time 0.10Magnitude 0.49Score 0.29
TR
𝕏
$BTC
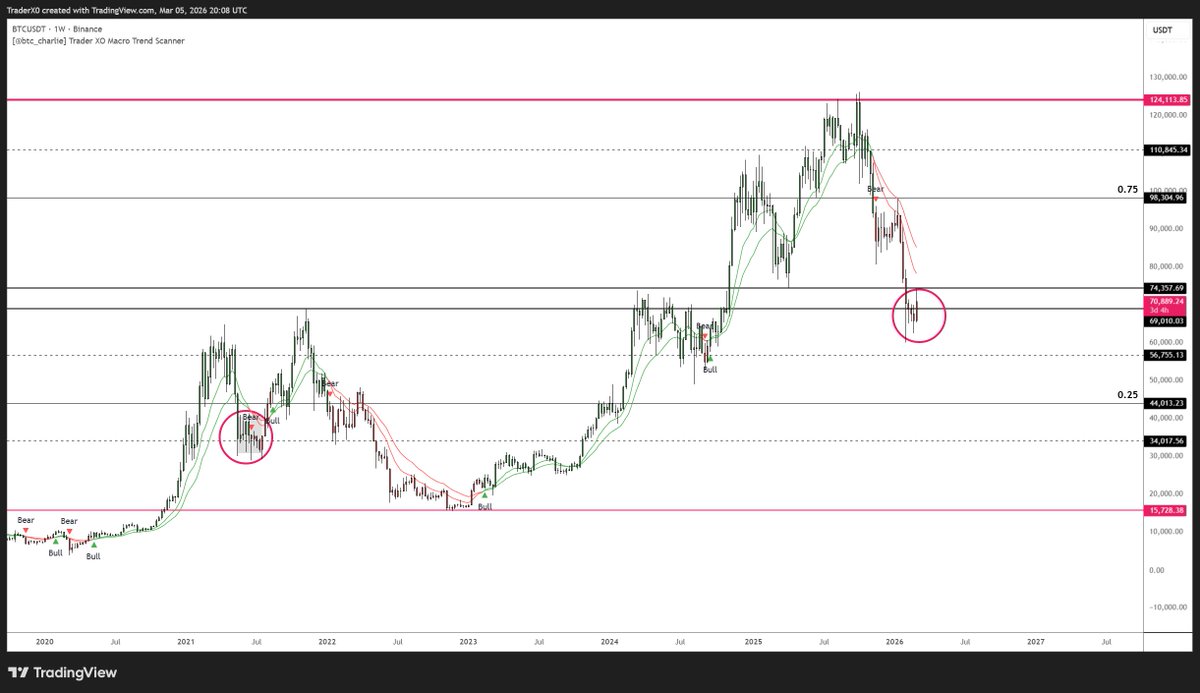
I don’t have a particularly strong directional view tbh, price largely remains rotational.
Structurally, I wouldn’t be surprised to see a regime similar to May – July 2021 where the market oscillated within a compressed range before resolving, not something I’m overly fussed about trading.
Areas Of Interest =>
On the daily, the 12/21/25 EMAs around 70k–69k are key support imo, confluent with the 4-week composite value area high, ideally I'd want to see this hold. Trading below that level which is key imo, would likely have me leaning towards price taking the February lows, potentially into the 58s or near equal lows. If those levels hold, I’d be interested in longs for a range play - again if it sets up.
If we see further upside in the coming weeks, the 80–82k region stands out as meaningful resistance, confluent with the February high and single prints, with a typical mean reversion play back up into the 12/21/25 weekly EMA bands. I may contemplate selling there if it sets up from an order flow perspective.

Max Favorable +4.6%Max Adverse −11.6%Opportunity 0.24Time 0.35Magnitude 0.24Score 0.27
TR
𝕏
Bitcoin
Historically, whenever Bitcoin has broken below the 50-week moving average, it has often signaled a deeper move toward the 200MA or even the 300-week MA.
Since 2015, one pattern has remained consistent: Bitcoin tends to treat the 200-week MA as a major cycle support area.
Price has only dipped beneath the 300-week MA only once in its history and anything below the 200MA has been short lived for the best part of cycle lows.
If we revisit those levels, and the broader market context aligns, I’d view that zone as a high-probability buying opportunity...
Unless this time is... different.... ?

Max Favorable +38.1%Max Adverse +0.0%Opportunity 0.84Time 1.00Magnitude 0.84Score 0.90