@ColinTcrypto
“@ColinTcrypto posts predominantly bullish calls across BTC, ETH, and meme coins like DOGE and PEPE, with 45.8% accuracy over 345 calls and best results on longer timeframes (49.2%). Their most distinctive pattern is a high volume of Break/Pump and Wick/Liquidity grab setups, suggesting a momentum and liquidity-focused approach.”
Score Breakdown
| CallRank Score | Move · Path · Time | Scored | |
|---|---|---|---|
| ALL-TIME | 45% | 0.59 · 0.45 · 0.44 | 366 |
| YTD | 41% | 0.57 · 0.40 · 0.38 | 169 |
| 30D | — | — | 0 |
CallRank Score by Duration
Short term45% 78 calls
Medium term44% 206 calls
Long term50% 82 calls
CallRank Score · Last 12 Months
Asset Breakdown — Top 5
| Asset | CallRank Score | Calls | 🟢 Bull · 🔴 Bear |
|---|---|---|---|
| BTC | 46% | 321 | 225 · 96 |
| ETH | 43% | 31 | 24 · 7 |
| AERO | 47% | 3 | 1 · 2 |
| DOGE | 26% | 3 | 0 · 3 |
| PEPE | 19% | 3 | 1 · 2 |
Live Calls Summary · By Horizon
@ColinTcrypto's active forecasts grouped by horizon and asset. L = Long, S = Short, number = open call count.
Active assets for this forecaster:
| No assets selected | |
|---|---|
| ST | — |
| MT | — |
| LT | — |
ST = Short term · MT = Medium term · LT = Long term
Active Calls · 13 Live
CO
𝕏
Last cycle, $BTC spent 46 weeks below the 200-week moving average.
This cycle (so far), $BTC has been below it for just 1-2 weeks.
Many point to the 200-week MA as a bottom zone indicator, but it has historically been an extremely wide and variable zone.
The two cycles before the last one had much briefer durations below the 200-week MA, but those were due to sudden drops below it that rebounded quickly.
Price in the current cycle has chopped around the 200-week MA without a sharp break lower, unlike the brief dips and quick rebounds in the two prior cycles. This behavior may produce a longer duration below the average.
Furthermore, in all three previous cycles, the price declined to near the 300-week MA (not pictured). That has not occurred yet. A move to that zone would involve additional time below the 200-week MA.
Thus, it looks to me like everything is still lining up for a cycle low later this year, likeliest to be within a month of October (as a starting point for an educated guess).
Bear market patience is a marathon-- not a sprint.

Max Favorable +1.0%Max Adverse −0.2%ACTIVE
CO
𝕏
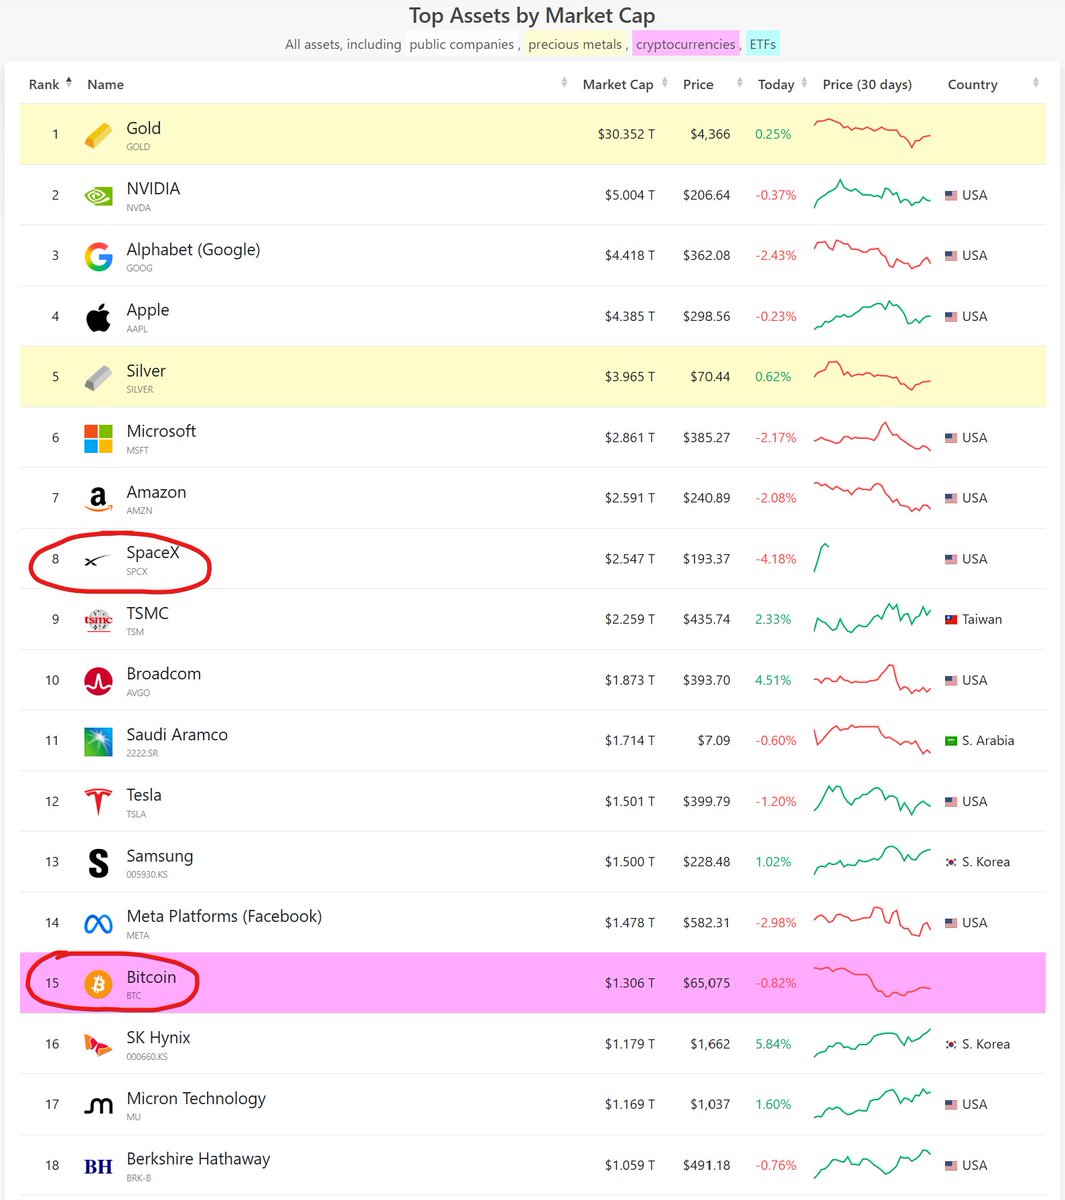
$BTC has dropped to rank #15 among all assets during its bear market. 😢
For reference, it was 5th place in April 2025, with a market cap of $1.86T, surpassing Alphabet, Google, Silver and Amazon at the time.
This is the nature of a volatile asset that outpaces other assets in the long run.
I expect BTC will reach the top 5 (again) within 5-10 years.
Also: @SpaceX $SPCX teleported into to rank #8. 😅
Max Favorable +1.9%Max Adverse −11.4%ACTIVE
CO
𝕏
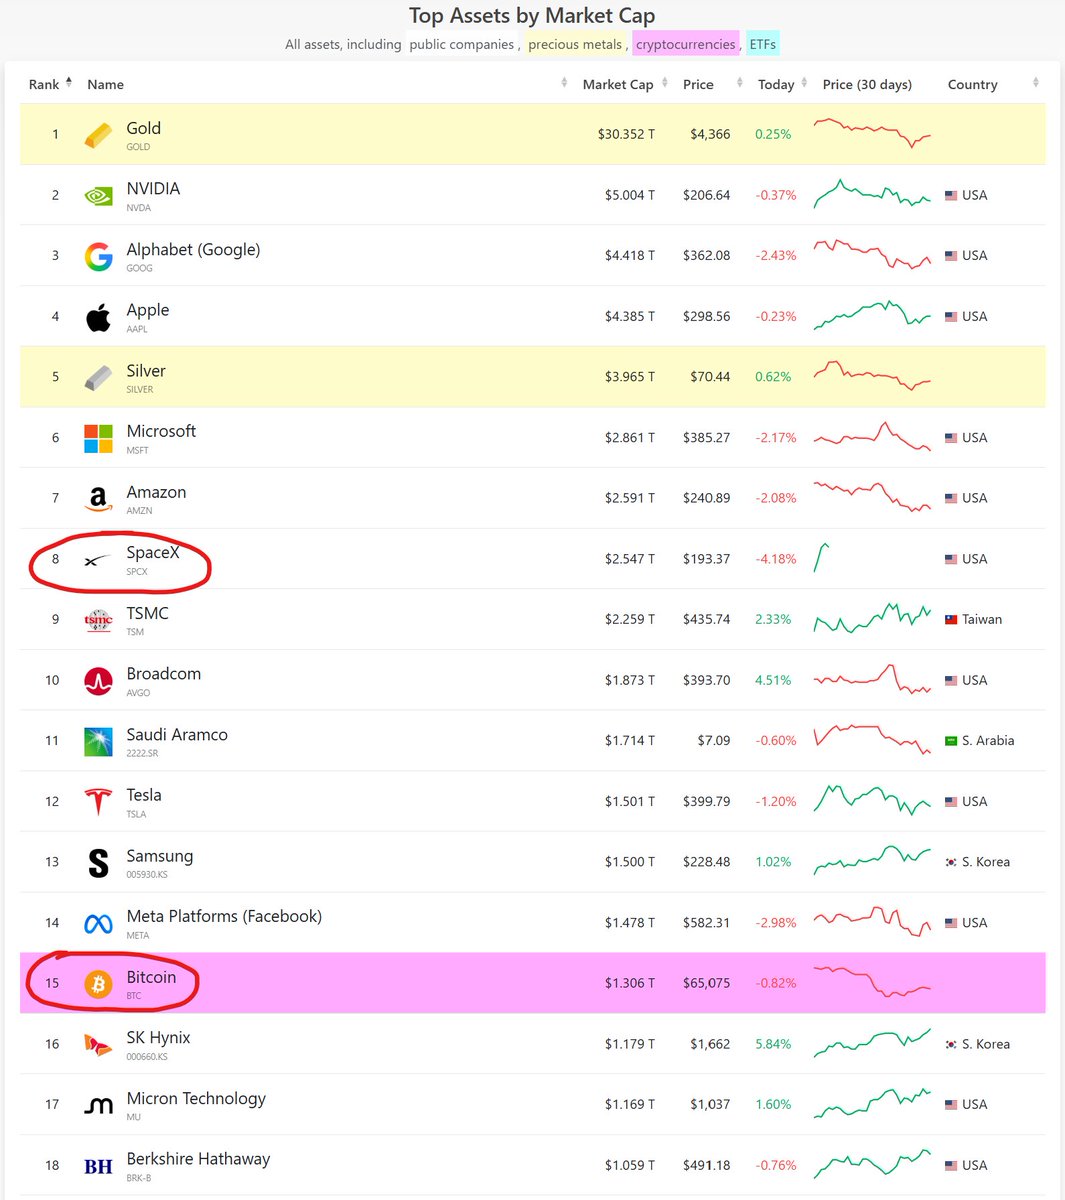
$BTC is currently rank #15 among all assets.
It was 5th place in April 2025, with a market cap of $1.86T, surpassing Alphabet, Google, Silver and Amazon at the time.
Bitcoin has some rank to climb. I expect it will reach the top 5 (again) within 5-10 years.
Also: @SpaceX $SPCX teleported into the top 10. 😅
Max Favorable +1.9%Max Adverse −11.4%ACTIVE
CO
𝕏
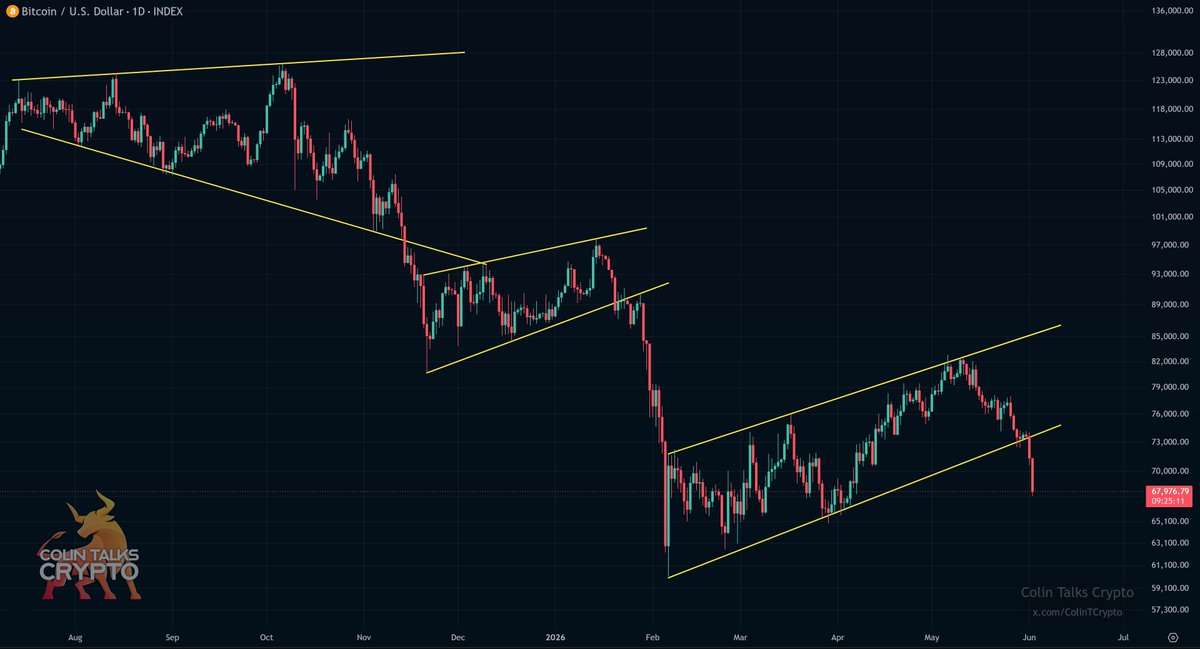
$BTC - Pretty straightforward chart.
Many wanted to overcomplicate this with"this time is different", but bitcoin is just doing the same thing it always does in bear markets. It breaks down. And it definitely takes longer than 4 months (Oct->Feb $60k), despite the hopium to want otherwise.
I think it's more likely than many still want to admit that we see lower lows this year.
Max Favorable +15.0%Max Adverse −0.4%ACTIVE
CO
𝕏
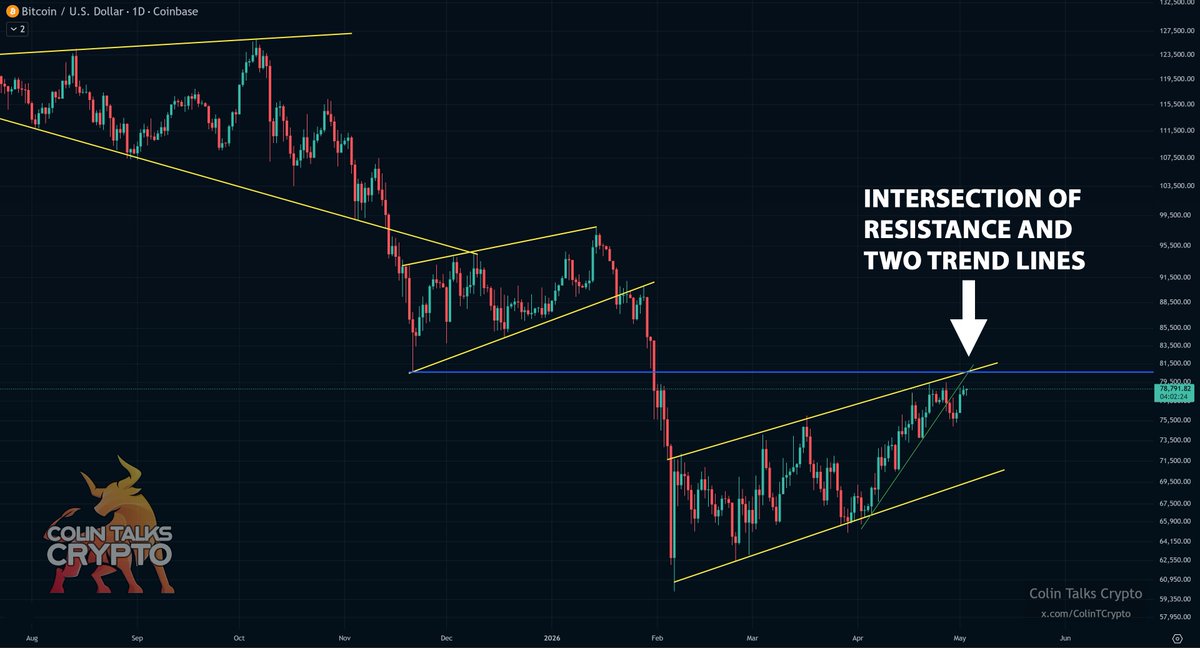
Bitcoin is nearing an interesting spot on the chart.
It's the intersection of 2 trend lines and one horizontal resistance level.
As such, I give $BTC a 50% chance of finding a local top around this intersection spot, but if it happens to break above the channel, then it probably moves a good deal higher, perhaps finding a local top around the $84k-$86k zone (where the most immediate and signficant horizontal resistance can be found from the previous consolidation range).
As such, I'm spacing out my next profit taking (10% of my portfolio) in two traunches-- half of my sells just under $80k and the other half around $84k. I am obviously still of the belief that this is a relief rally and we'll see a revisit of $60k's range (or lower) later this year.
I notice in the comments section of my recent posts that quite a few of you disagree that we are in a relief rally. These individuals strongly believe we are in a bull run, and that "this time is different" for all sorts of various reasons and charts. I disagree, but that's ok and I'm not going to attack anybody for differing views (after all, there's always a chance I am wrong, as any analyst could be with any market view at any time).
So, just know that I respect your choice to disagree with me, even if we don't see eye to eye. All I ask is that you keep is civil in the discussion. And at least I have the cajones to speak my mind. Whether I end up being right or wrong, that alone should be worth something.
Max Favorable +26.6%Max Adverse −5.2%ACTIVE
Scored Calls · Full Audit Trail
CO
𝕏
$BTC
When you get bad news and the price doesn’t move much, you know you’re getting close to the bottom.
We just saw:
• Multiple crypto exchanges fail (AscendEX, BitMEX, BitMart).
• A Coldcard security failure resulting in tens of millions of dollars in lost user funds.
• MicroStrategy sells hundreds of millions of dollars worth of BTC.
The bottom is close. Some think the bottom is already in. I think it’s yet to come, but not far off.
Max Favorable +0.0%Max Adverse −1.5%Opportunity 0.03Time 0.00Magnitude 0.03Score 0.01
CO
𝕏
$BTC
When you get bad news and the price doesn’t move much, you know you’re getting close to the bottom.
We just saw:
• Multiple crypto exchanges fail (AscendEX, BitMEX, BitMart).
• A Coldcard security failure resulting in tens of millions of dollars in lost user funds.
• MicroStrategy sells hundreds of millions of dollars worth of BTC.
The bottom is close.
Some think the bottom is already in. I think it’s yet to come, but not far off.
Max Favorable +0.0%Max Adverse −1.5%Opportunity 0.03Time 0.00Magnitude 0.03Score 0.01
CO
𝕏
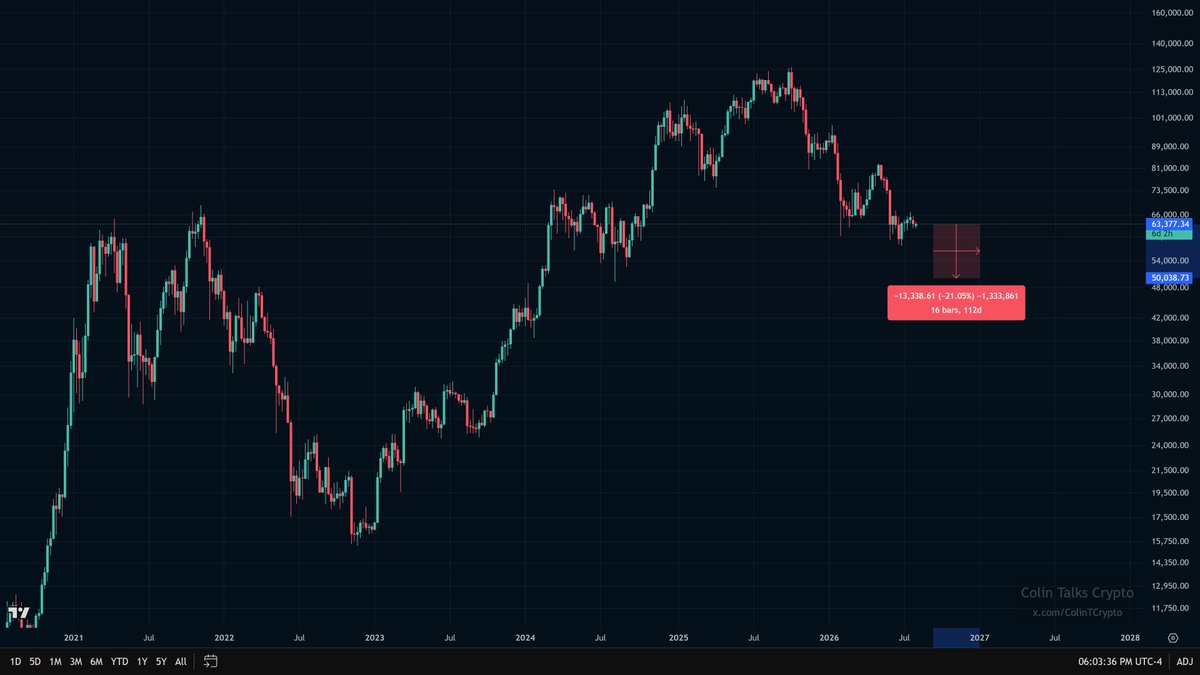
$BTC is currently $63,549
$ETH is currently $1,862
If $BTC finds a cycle low at $50k that would be a 21% drop from where it is today. Imo, $50k would actually be quite bullishly high for a bear market bottom, because it would only be a 60% drop from the highs. That would be great performance for a bear market.
$ETH, being beta to BTC, would likely drop more than BTC, so I'd assume it would drop 30% or greater. That would put it closer to $1,300 or lower. ETH is pushing into resistance currently, so it seems likely we see lower prices.
Just some napkin math.

Max Favorable +0.6%Max Adverse −0.8%Opportunity 0.41Time 0.00Magnitude 0.41Score 0.22
CO
𝕏
Noticing people getting cocky on the timeline about the $BTC bottom being in.
On a measly $5k rally or whatever.
That’s not a good sign for bulls.
Optimism has accompanied every relief rally to date. Obviously one of them will be the true bottom, but is optimism and cockiness the proper sentiment for a bottom? Probably not.
Will the price go a bit higher before dropping again? Probably. Remember: I have been entirely open to the idea that BTC revisits the 200-day MA. That’s around $70k-$72k. BTC has retested this twice in prior bear markets as well.
However, I give low odds to the bottom being in. Notice I didn’t say impossible. But low odds. But those coming at me saying “I had better adjust my strategy” will likely disappear in a few months at a bare minimum the lows get swept again around Sept-Nov.


Max Favorable +0.9%Max Adverse −6.2%Opportunity 0.67Time 0.05Magnitude 0.67Score 0.23
CO
𝕏
$BTC sees a tiny pump and hope floods the timeline.
Every. Single. Relief rally.
There’s still too much hope and enthusiasm for the bottom to be in.
I think $BTC may go as high as the 200-day MA (around $70k-$71k) before dumping again.
Enjoy the relief rally. The bottom isn’t confirmed yet.


Max Favorable +3.5%Max Adverse −3.3%Opportunity 0.55Time 0.49Magnitude 0.55Score 0.45