@alicharts
“@alicharts maintains 51.4% accuracy across 1,530 calls, focusing on BTC and major alts with a bullish lean and a preference for mid-term Break/Pump setups. Their edge shows up most clearly in mid-term calls (52.5%), where their high volume of structured breakout forecasts gives them a reliable read on momentum plays.”
Score Breakdown
| CallRank Score | Move · Path · Time | Scored | |
|---|---|---|---|
| ALL-TIME | 51% | 0.61 · 0.45 · 0.45 | 1558 |
| YTD | 49% | 0.61 · 0.45 · 0.44 | 367 |
| 30D | — | — | 0 |
CallRank Score by Duration
Short term51% 458 calls
Medium term52% 818 calls
Long term48% 282 calls
CallRank Score · Last 12 Months
Asset Breakdown — Top 5
| Asset | CallRank Score | Calls | 🟢 Bull · 🔴 Bear |
|---|---|---|---|
| BTC | 49% | 245 | 134 · 111 |
| XRP | 54% | 145 | 86 · 59 |
| SOL | 54% | 129 | 80 · 49 |
| DOGE | 51% | 127 | 99 · 28 |
| ETH | 52% | 114 | 64 · 50 |
Live Calls Summary · By Horizon
@alicharts's active forecasts grouped by horizon and asset. L = Long, S = Short, number = open call count.
Active assets for this forecaster:
| No assets selected | |
|---|---|
| ST | — |
| MT | — |
| LT | — |
ST = Short term · MT = Medium term · LT = Long term
Active Calls · 20 Live
AL
𝕏
Ethena $ENA keeps getting more bullish.
A weekly TD Sequential buy signal was followed by a 17% rally, and now both the RSI and ChandeMO are flashing bullish divergences.
If this momentum continues, $0.13 could be next. https://t.co/CgEcKcl2e7

Max Favorable +0.5%Max Adverse −2.6%ACTIVE
AL
𝕏
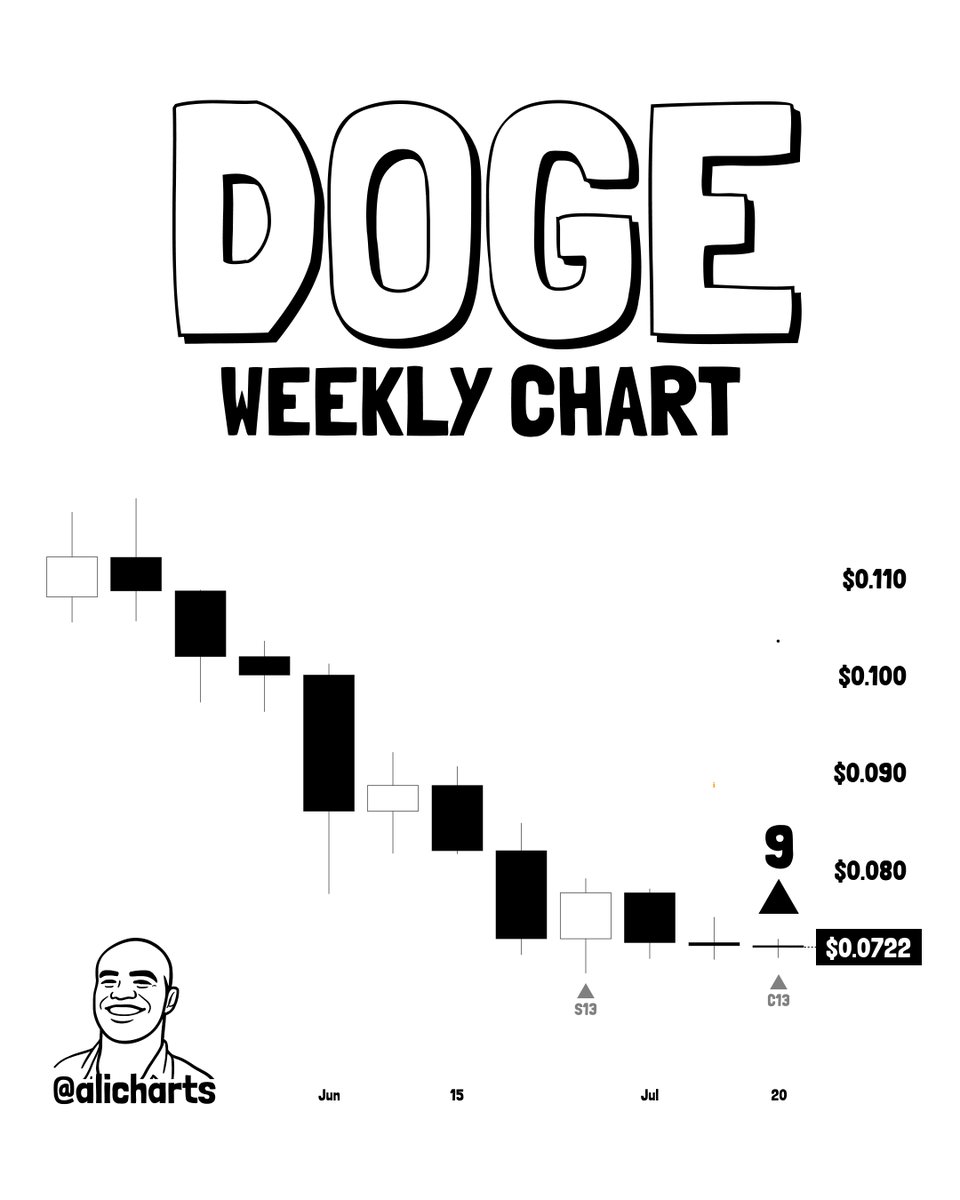
Dogecoin $DOGE just keeps printing buy signals.
The weekly TD Sequential has now flashed multiple consecutive buy signals—a rare setup that could be warning a major bull rally is approaching. https://t.co/DrOI9nqJ2I
Max Favorable +2.0%Max Adverse −0.4%ACTIVE
AL
𝕏
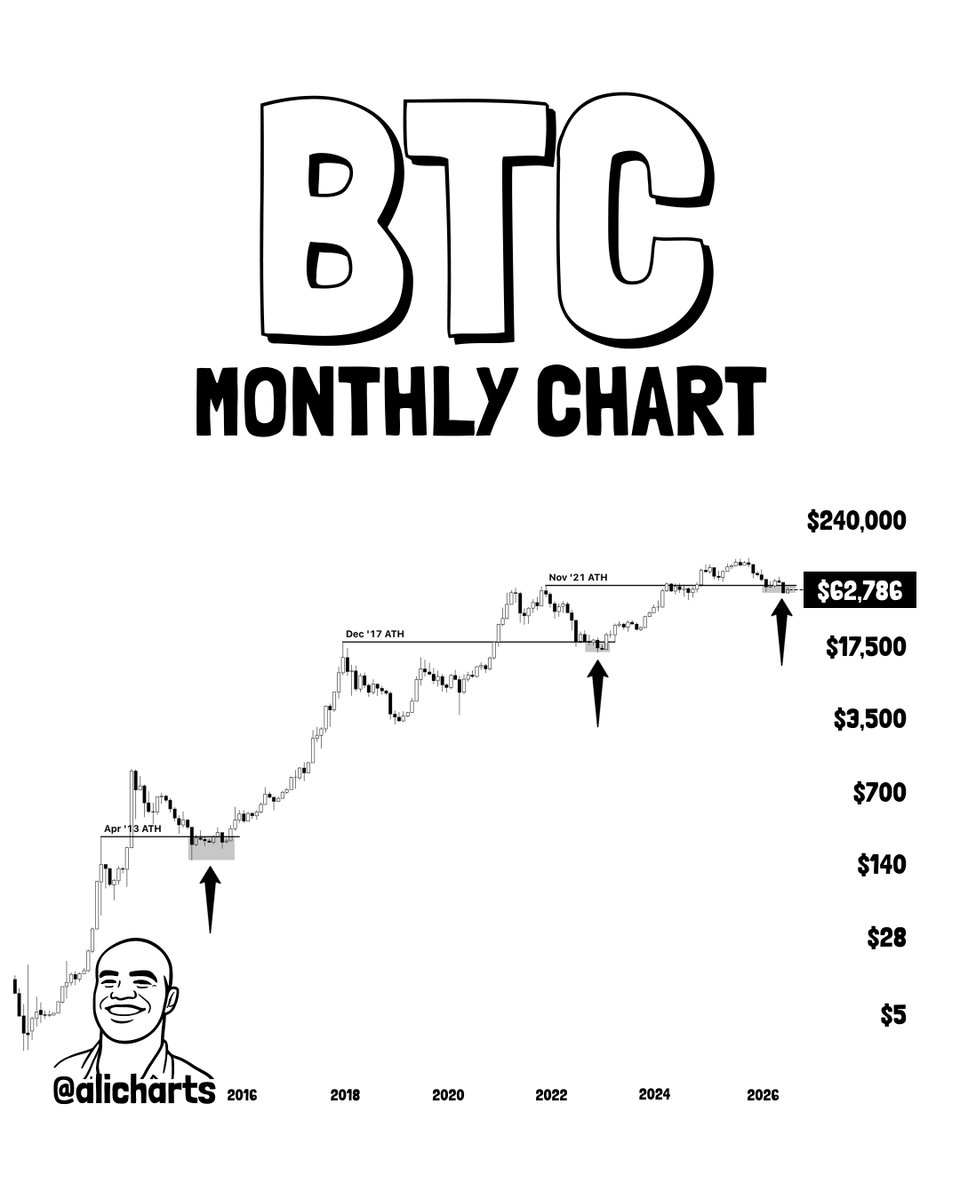
Looking at Bitcoin's price history, there have been very few occasions where, during a bear market, it traded below the previous cycle's all-time high.
• 2015 Cycle: After peaking in late 2013, Bitcoin eventually fell below the previous cycle high around $259. For long-term investors, that proved to be an exceptional accumulation zone, leading to a rally of more than 7,500% over the following cycle.
• 2022 Cycle: A similar event occurred after the 2021 bull market. In late 2022, Bitcoin dropped below the previous all-time high of roughly $19,660. Investors who accumulated around that former peak saw Bitcoin eventually rally more than 550% to its ultimate October 2025 peak of $126,198.
• Today: The previous all-time high from the 2021 cycle sits around $69,000. Since June, Bitcoin has traded below that level once again.
History doesn't guarantee the same outcome, but previous cycles show that reclaiming the prior cycle's all-time high has often marked the transition from a bear market back into a sustained bull trend.
If $BTC can successfully reclaim $69,000 and hold it as support, it would be another strong piece of evidence suggesting that the next major uptrend could already be underway.
PENDING TRIGGER
AL
𝕏
Don't obsess over timing the exact bottom.
One of the biggest mistakes I see is people mixing their long-term investment portfolio with their trading account.
I keep them completely separate.
Personally, I allocate:
• 90% of my capital to long-term spot investments.
• 10% of my capital to active trading.
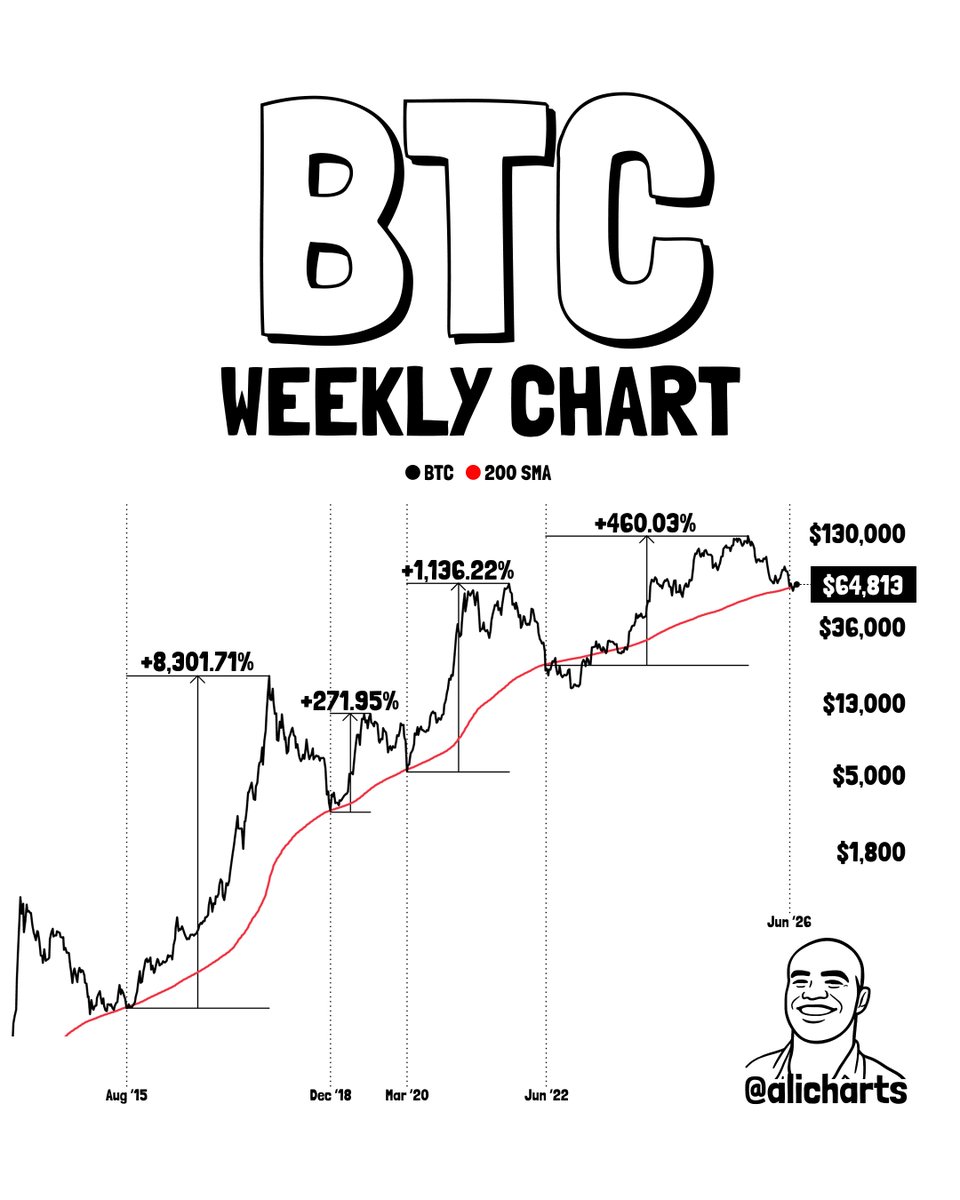
If you look at Bitcoin over the past 10 years, every time it has traded near the 200-week moving average, it has eventually proven to be an exceptional long-term buying opportunity.
Very few investors bought at the exact bottom.
They didn't have to.
With Bitcoin's diminishing returns as the asset matures, you now need substantially more capital to generate life-changing gains from simply buying and holding. But if you have that capital, I don't think it's worth obsessing over catching the exact bottom.
Instead, focus on gradually accumulating when Bitcoin trades in historically attractive valuation zones.
Personally, I believe even current prices represent an attractive long-term accumulation area.
My plan is to accumulate during periods of weakness and look to take profits during the next major cycle, around 2029.
You don't have to buy the exact bottom to achieve outstanding long-term returns.
Max Favorable +0.0%Max Adverse −4.0%ACTIVE
AL
𝕏
SOLANA: BUY SIGNAL
A new buy signal has emerged for Solana. But one massive resistance zone stands between the current price and a potential rally to $100–$127.
Here’s the level that could decide the next major move for $SOL.
1/7 🧵👇
PENDING TRIGGER
Scored Calls · Full Audit Trail
AL
𝕏
SOLANA BREAKOUT. TARGET $100.
1/5 🧵👇
Max Favorable +0.0%Max Adverse −0.3%Opportunity 0.03Time 0.00Magnitude 0.03Score 0.02
AL
𝕏
ETHEREUM IS HEADING TO $3,000
1/6 🧵👇
Max Favorable +0.4%Max Adverse −1.1%Opportunity 0.28Time 0.00Magnitude 0.28Score 0.14
AL
𝕏
The TD Sequential called the Ethereum rally.
It flashed a buy signal near $1,500, just before a 31.5% move higher.
Now, with $ETH trading around $1,980, the indicator has flipped to a sell signal. It may be time to lock in some profits. https://t.co/TLcLToGrtS

Max Favorable +0.1%Max Adverse −0.2%Opportunity 0.07Time 0.00Magnitude 0.07Score 0.10
AL
𝕏
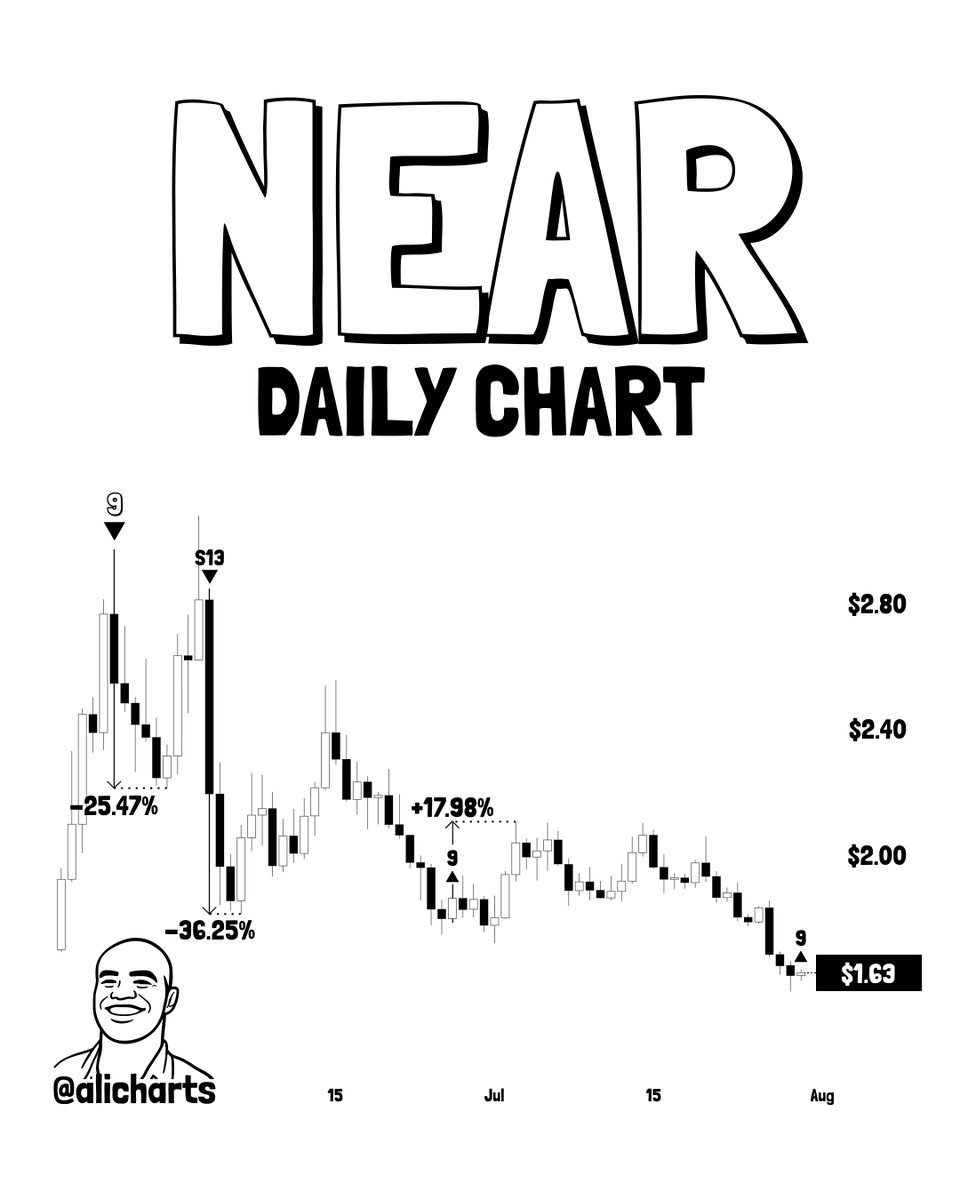
Another TD Sequential buy signal has appeared on $NEAR.
The last few signals from this indicator have done an impressive job of calling major trend shifts. If it stays true to form, Near Protocol could be gearing up for another rebound. https://t.co/04cPejLD0H
Max Favorable +2.1%Max Adverse −0.7%Opportunity 0.64Time 1.00Magnitude 0.64Score 0.62
AL
𝕏
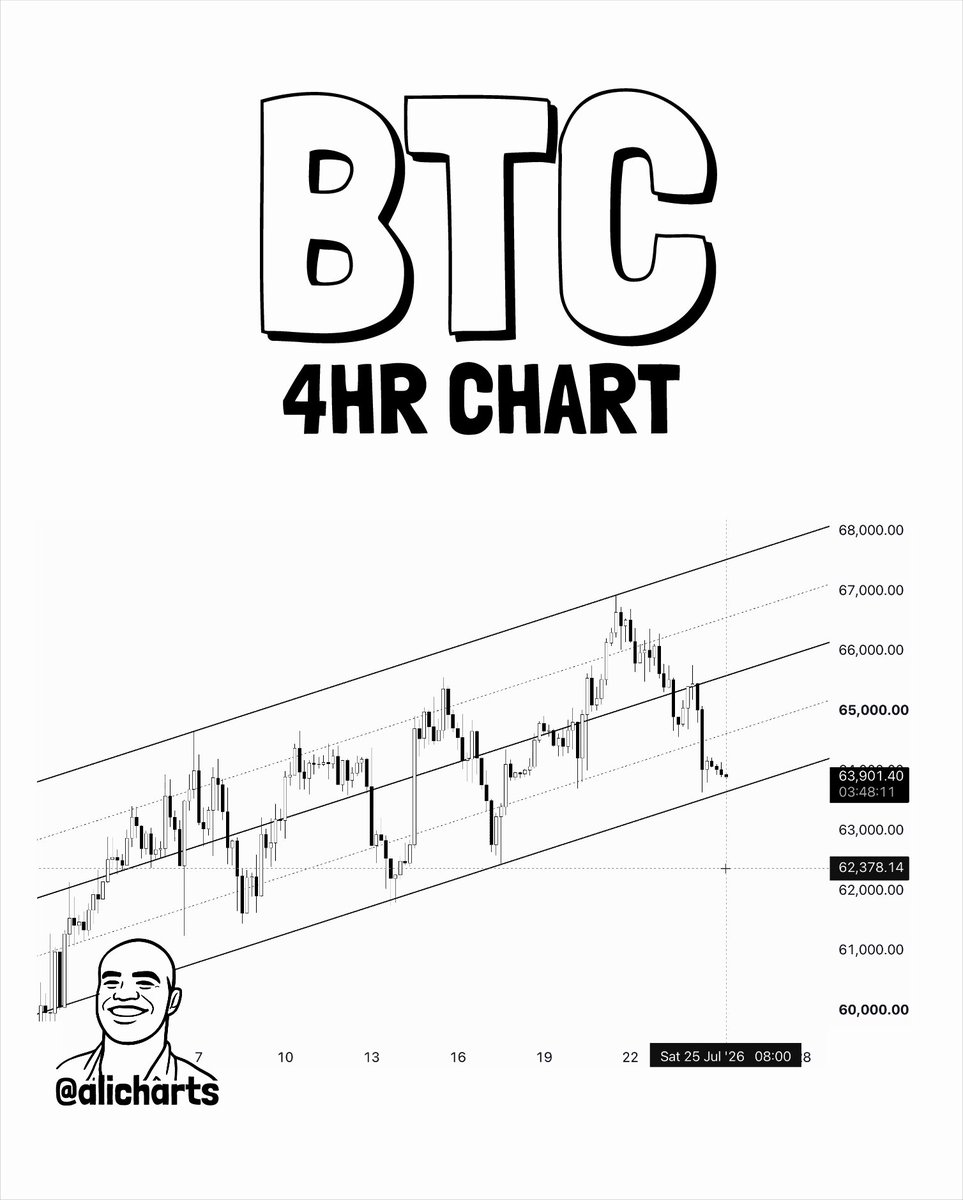
Keep an eye on Bitcoin $BTC at $63,800.
If this level holds as support, I'm watching for a rebound toward $67,000. But if it breaks, the next downside target sits around $60,000. https://t.co/kAn0hDIEmc
Max Favorable +2.4%Max Adverse −2.7%Opportunity 0.71Time 0.47Magnitude 0.71Score 0.47