@alienops
“@alienops is a Sharp-tier forecaster with 53% all-time accuracy across 288 calls, specializing in BTC, ETH, SOL, and XRP with a balanced long/short bias and improving 58.5% accuracy YTD. Their edge lies in long-term calls (60.6% accuracy) and high-volume wick/liquidity grab setups, where pattern recognition across 52 calls shows consistent structural awareness.”
Score Breakdown
| CallRank Score | Move · Path · Time | Scored | |
|---|---|---|---|
| ALL-TIME | 52% | 0.65 · 0.50 · 0.49 | 318 |
| YTD | 55% | 0.64 · 0.55 · 0.56 | 111 |
| 30D | — | — | 0 |
CallRank Score by Duration
Short term50% 140 calls
Medium term49% 104 calls
Long term61% 74 calls
CallRank Score · Last 12 Months
Asset Breakdown — Top 5
| Asset | CallRank Score | Calls | 🟢 Bull · 🔴 Bear |
|---|---|---|---|
| BTC | 53% | 144 | 59 · 85 |
| ETH | 53% | 108 | 88 · 20 |
| SOL | 56% | 14 | 8 · 6 |
| XRP | 37% | 10 | 9 · 1 |
| APT | 39% | 5 | 3 · 2 |
Live Calls Summary · By Horizon
@alienops's active forecasts grouped by horizon and asset. L = Long, S = Short, number = open call count.
Active assets for this forecaster:
| No assets selected | |
|---|---|
| ST | — |
| MT | — |
| LT | — |
ST = Short term · MT = Medium term · LT = Long term
Active Calls · 12 Live
AL
𝕏
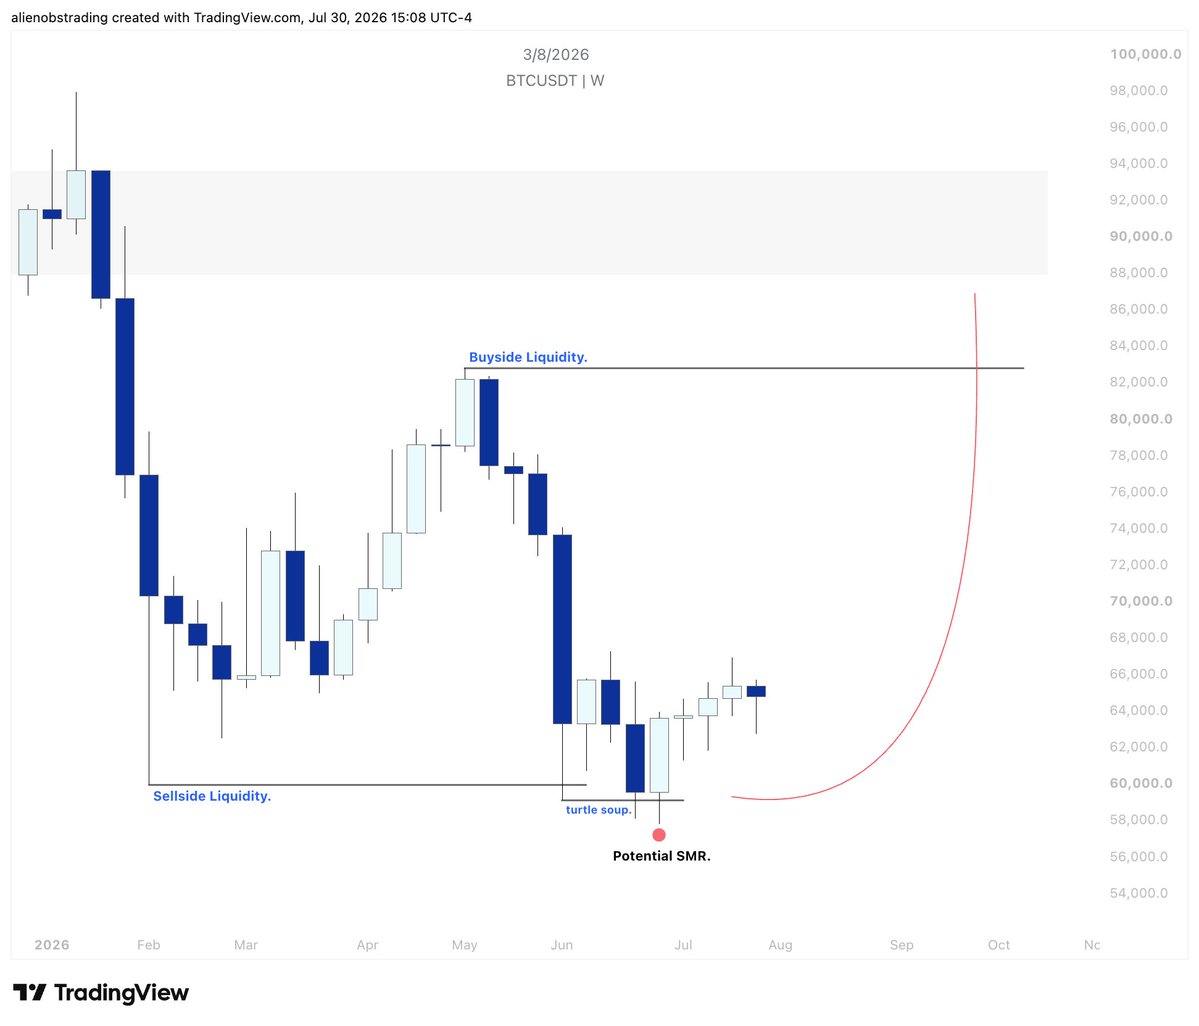
$BTC - Weekly Outlook.
I believe the potential SMR developing here could be the catalyst for a move toward +$80K.
See you at the target.🎯 https://t.co/v1VeqT4JkF
Max Favorable +0.9%Max Adverse −1.0%ACTIVE
AL
𝕏
$BTC
𝗧𝗵𝗲 𝗵𝗶𝗴𝗵𝗲𝗿-𝘁𝗶𝗺𝗲𝗳𝗿𝗮𝗺𝗲 𝘀𝘁𝗿𝘂𝗰𝘁𝘂𝗿𝗲 𝗿𝗲𝗺𝗮𝗶𝗻𝘀 𝘄𝗲𝗮𝗸.
Still, I believe the most unexpected path for 2026 may also be the most logical: a convincing bullish rally above the weekly moving averages, strong enough to rebuild optimism and make the broader weakness appear resolved.
𝗠𝘆 𝘁𝗵𝗲𝘀𝗶𝘀: 𝗮 𝗳𝗮𝗶𝗹𝗲𝗱 𝗯𝘂𝗹𝗹𝗶𝘀𝗵 𝗯𝗿𝗲𝗮𝗸𝗼𝘂𝘁.
A temporary reclaim of the weekly MAs, followed by rejection and acceptance back below them, then the capitulation phase.
Only after that would I begin looking for a genuine higher-timeframe reversal in 2027.
𝗕𝗼𝗼𝗸𝗺𝗮𝗿𝗸 𝘁𝗵𝗶𝘀.
We’ll revisit the roadmap as we enter 2027.

Max Favorable +0.2%Max Adverse −1.6%ACTIVE
AL
𝕏
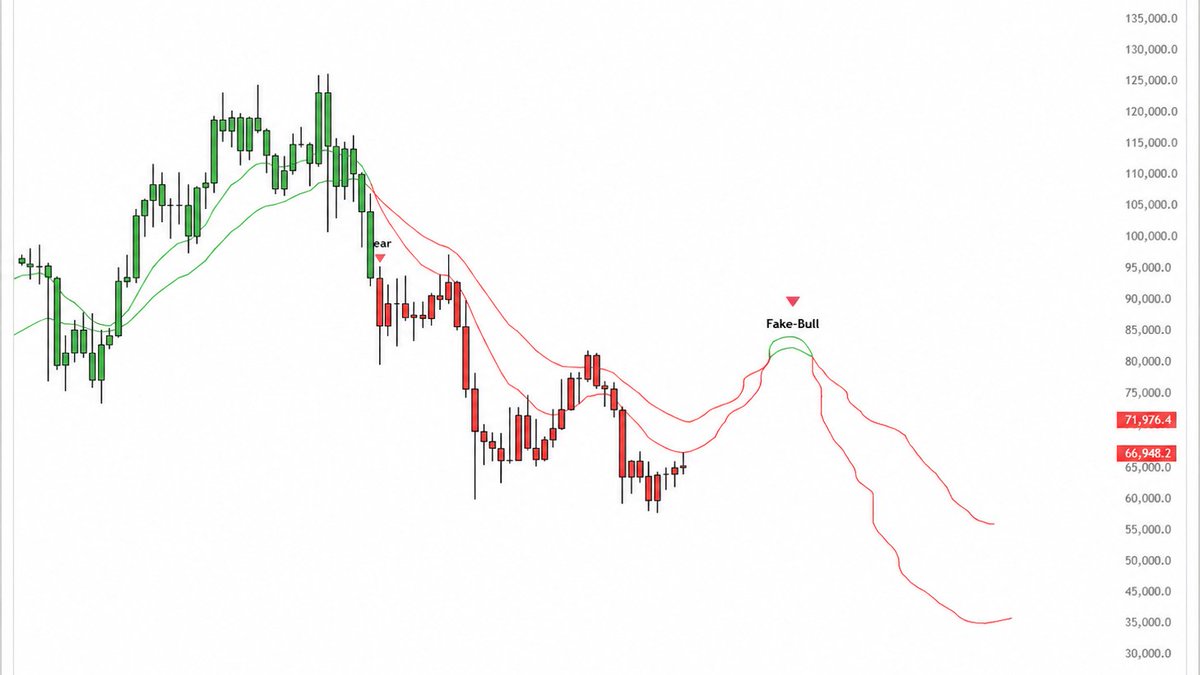
$BTC
𝗧𝗵𝗲 𝗵𝗶𝗴𝗵𝗲𝗿-𝘁𝗶𝗺𝗲𝗳𝗿𝗮𝗺𝗲 𝘀𝘁𝗿𝘂𝗰𝘁𝘂𝗿𝗲 𝗿𝗲𝗺𝗮𝗶𝗻𝘀 𝘄𝗲𝗮𝗸.
Still, I believe the most unexpected path for 2026 may also be the most logical: a convincing bullish rally above the weekly moving averages, strong enough to rebuild optimism and make the broader weakness appear resolved.
𝗠𝘆 𝘁𝗵𝗲𝘀𝗶𝘀: 𝗮 𝗳𝗮𝗶𝗹𝗲𝗱 𝗯𝘂𝗹𝗹𝗶𝘀𝗵 𝗯𝗿𝗲𝗮𝗸𝗼𝘂𝘁.
A temporary reclaim of the weekly MAs, followed by rejection and acceptance back below them—then the capitulation phase.
Only after that would I begin looking for a genuine higher-timeframe reversal in 2027.
𝗕𝗼𝗼𝗸𝗺𝗮𝗿𝗸 𝘁𝗵𝗶𝘀.
We’ll revisit the roadmap as we enter 2027.
Max Favorable +0.2%Max Adverse −1.6%ACTIVE
AL
𝕏
$BTC
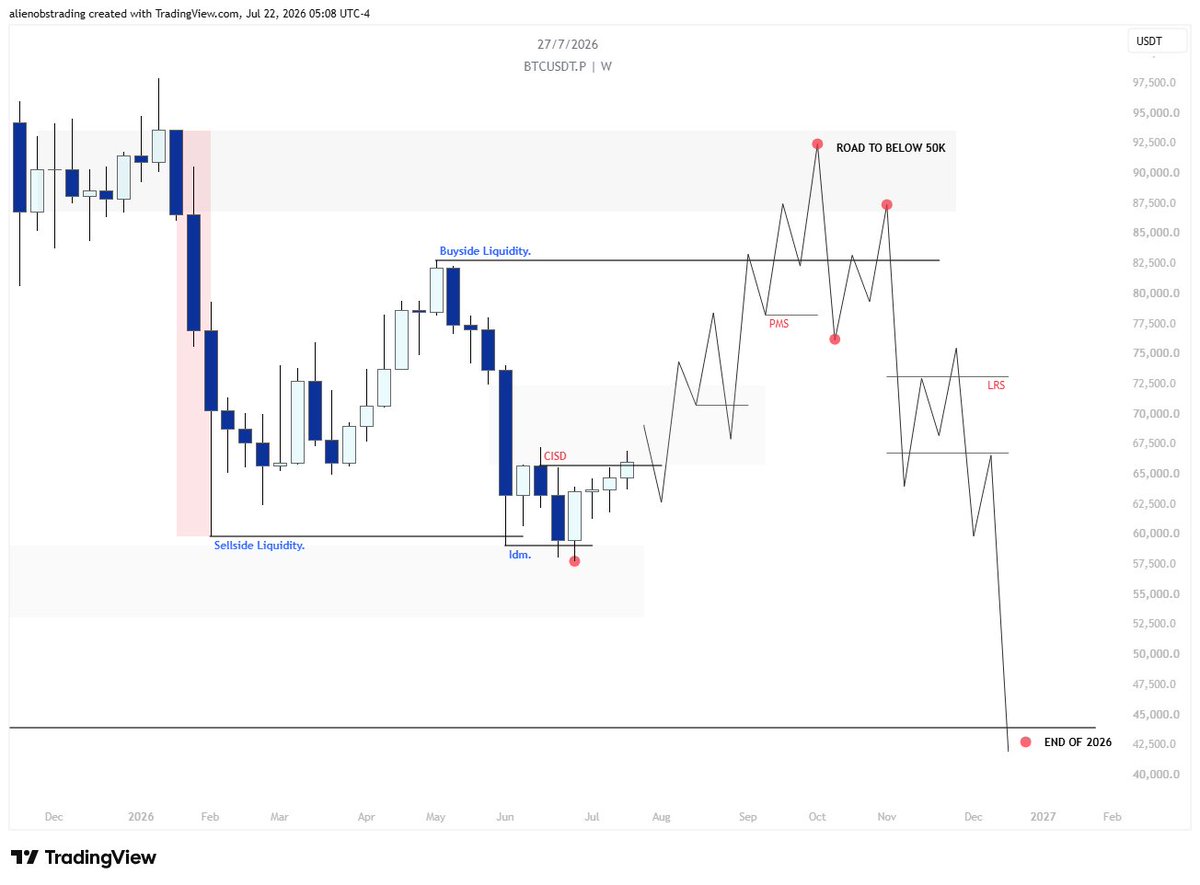
For the remainder of 2026, I believe a price path like this is a realistic possibility.
The key requirement is a confirmed CISD, followed by bullish continuation.
At first, many participants may conclude that "the bottom is in." However, in this scenario, the upside serves a different purpose: harvesting liquidity, completing the macro discount-to-premium cycle, and setting the stage for the real capitulation after a premium sweep.
I've tried to make the roadmap as clear as possible. Every major move on the chart is explained and supported by its underlying reasoning.
I know this isn't the type of price action CT is expecting, which is exactly why I find it interesting.
That said, the higher-timeframe structure still looks weak. A bullish continuation is less likely than a bearish resolution, but if the required conditions are met, it remains a valid possibility. Market makers rarely reward the consensus.
Under this scenario, ETH and altcoins could continue to outperform BTC, giving room for a meaningful mini bullszn before the macro trend resumes.
My long-term view remains unchanged: I still believe $BTC has a high probability of trading below $50K before the end of 2026.
Max Favorable +0.7%Max Adverse −0.6%ACTIVE
AL
𝕏
$BTC
I still don't think we've seen the final capitulation.
A 41% correction isn't enough to convince me that this cycle has found its ultimate bottom.
- to be continued.. https://t.co/iKOa67JXuC

Max Favorable +0.3%Max Adverse −2.6%ACTIVE
Scored Calls · Full Audit Trail
AL
𝕏
$BTC will put in its cycle bottom around $34K
Until price trades into that area, any claim that the bottom is already in is premature.
Save this. We’ll come back to it.
Max Favorable +0.4%Max Adverse −1.5%Opportunity 0.32Time 0.00Magnitude 0.32Score 0.14
AL
𝕏
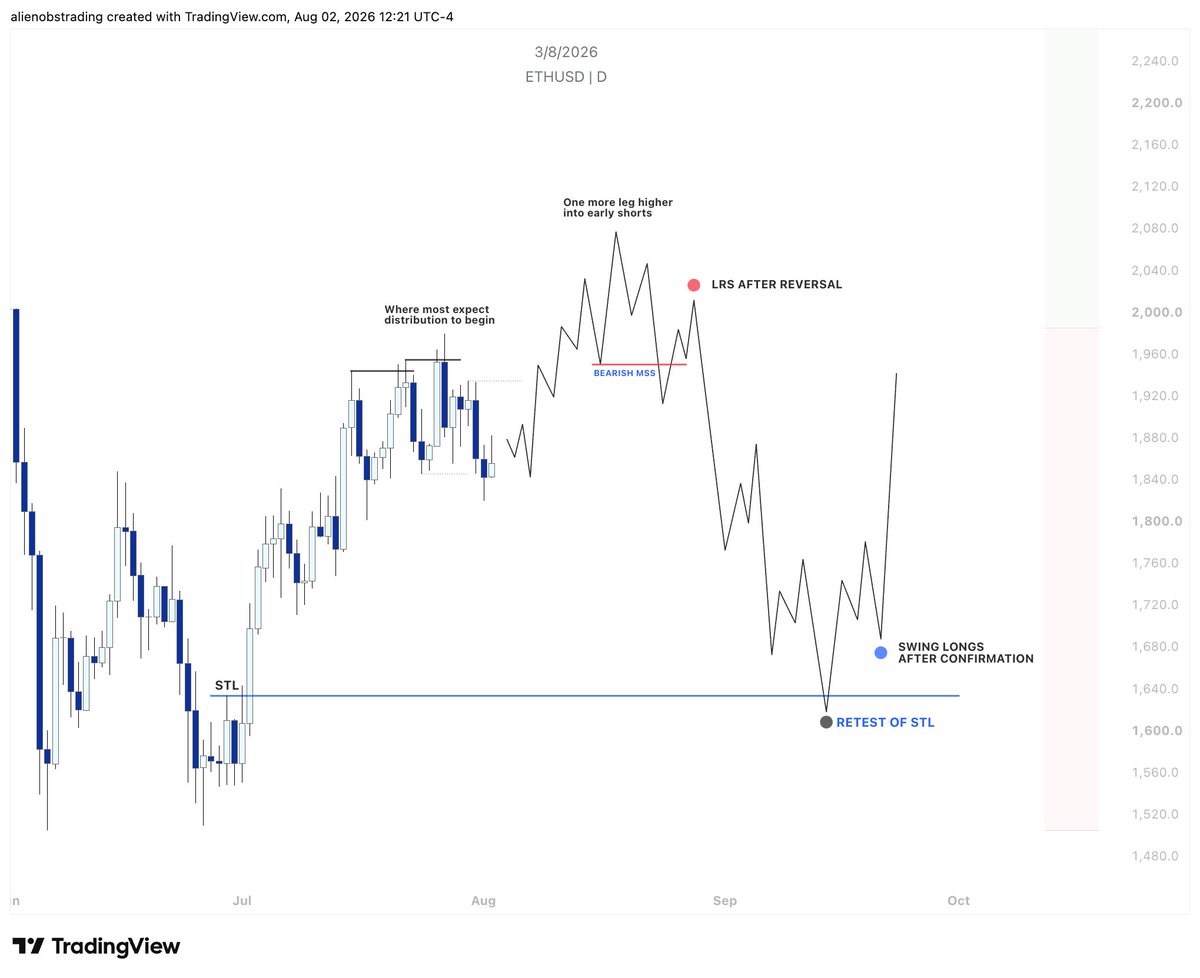
$ETH has yet to reach premium.
One more leg higher could trap early shorts. A bearish MSS would then create an LRS.
Much lower, an STL retest only puts swing longs in play after confirmation. https://t.co/qU6GaznX1E
Max Favorable +1.5%Max Adverse −0.1%Opportunity 0.74Time 1.00Magnitude 0.74Score 0.69
AL
𝕏
Some are waiting for $BTC at 160K.
I’m looking for maximum bullishness at 88–92K, followed by a full cycle reset into the 30Ks.
Same market. Different map. https://t.co/6LEQEVITXu

Max Favorable +0.3%Max Adverse −0.1%Opportunity 0.22Time 1.00Magnitude 0.22Score 0.50
AL
𝕏
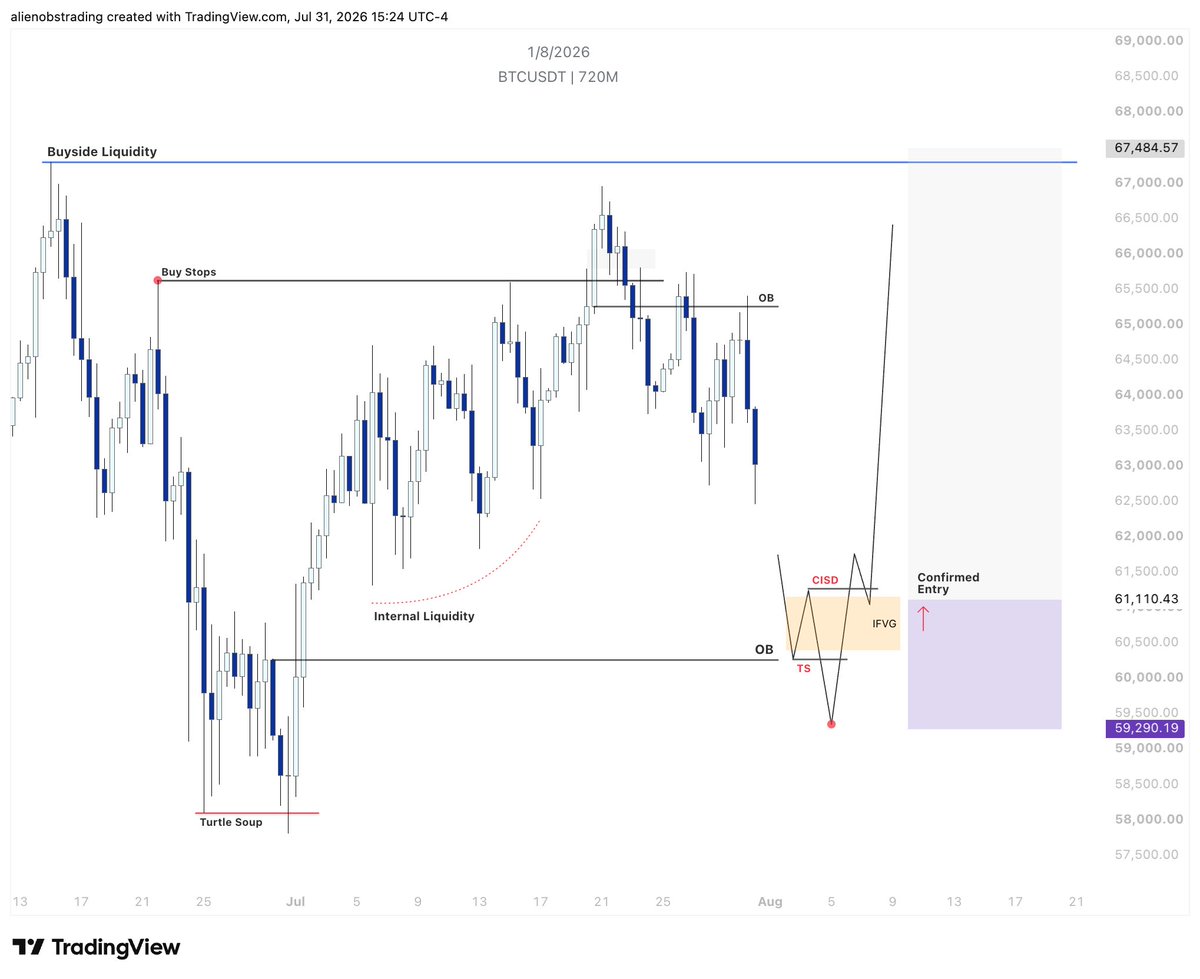
Give me a $BTC sweep into 59K–61K followed by CISD and I’m interested.
From there, 67.5K buyside liquidity is the draw. https://t.co/Zg52283j7D
Max Favorable +0.3%Max Adverse −0.1%Opportunity 0.28Time 0.50Magnitude 0.28Score 0.36
AL
𝕏
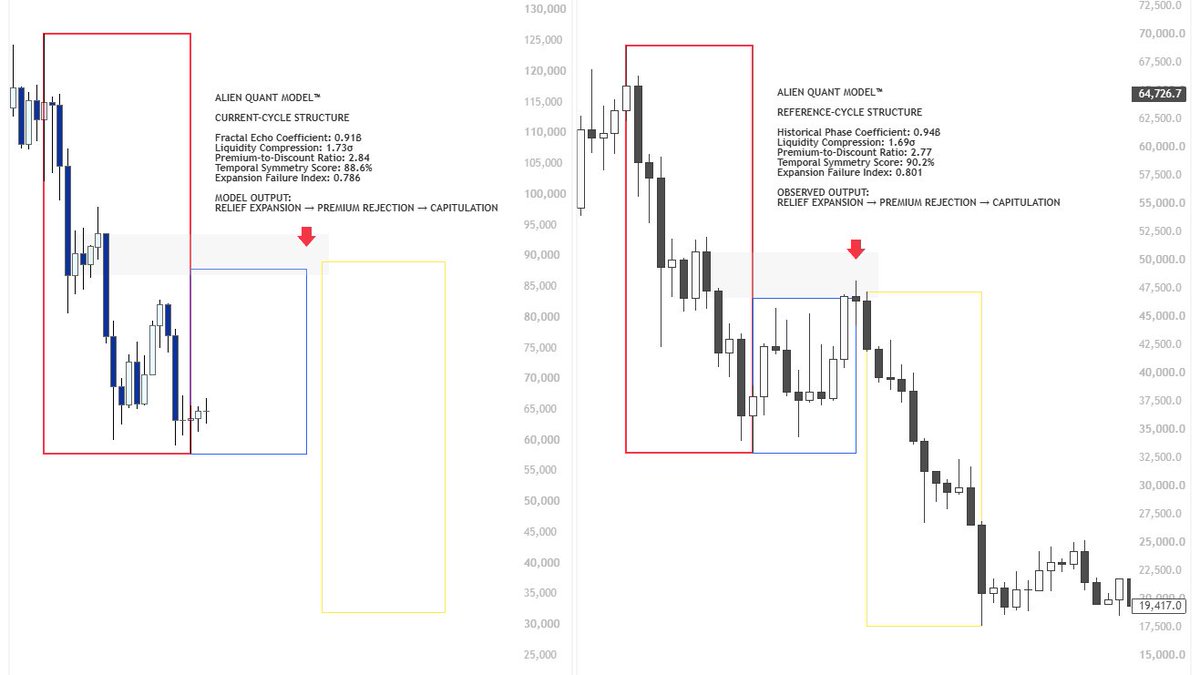
$BTC - My macro thesis remains simple:
A convincing relief rally first; strong enough to rebuild optimism, restore bullish positioning, and make the broader weakness appear resolved.
Then the real capitulation.
- The strongest trends often begin only after the market has rebuilt confidence.
- The most effective market-maker campaigns rarely move in a straight line.
Max Favorable +0.1%Max Adverse −0.4%Opportunity 0.09Time 0.00Magnitude 0.09Score 0.07