@stockmoneyL
“@stockmoneyL sits at 45.5% accuracy across 317 calls, focusing on BTC, ETH, and mid-cap alts like INJ and SUI with a strongly bullish lean (81% long calls) across short and mid-term horizons. Their edge lies in liquidity and wick setups, their most-used call type, where pattern recognition around price sweeps and reversals drives their approach.”
Score Breakdown
| CallRank Score | Move · Path · Time | Scored | |
|---|---|---|---|
| ALL-TIME | 45% | 0.62 · 0.41 · 0.42 | 338 |
| YTD | 41% | 0.55 · 0.41 · 0.39 | 98 |
| 30D | — | — | 0 |
CallRank Score by Duration
Short term46% 81 calls
Medium term46% 136 calls
Long term43% 121 calls
CallRank Score · Last 12 Months
Asset Breakdown — Top 5
| Asset | CallRank Score | Calls | 🟢 Bull · 🔴 Bear |
|---|---|---|---|
| BTC | 46% | 297 | 233 · 64 |
| ETH | 44% | 22 | 21 · 1 |
| INJ | 39% | 4 | 4 · 0 |
| SOL | 69% | 2 | 1 · 1 |
| ONDO | 48% | 2 | 2 · 0 |
Live Calls Summary · By Horizon
@stockmoneyL's active forecasts grouped by horizon and asset. L = Long, S = Short, number = open call count.
Active assets for this forecaster:
| No assets selected | |
|---|---|
| ST | — |
| MT | — |
| LT | — |
ST = Short term · MT = Medium term · LT = Long term
Active Calls · 20 Live
ST
𝕏
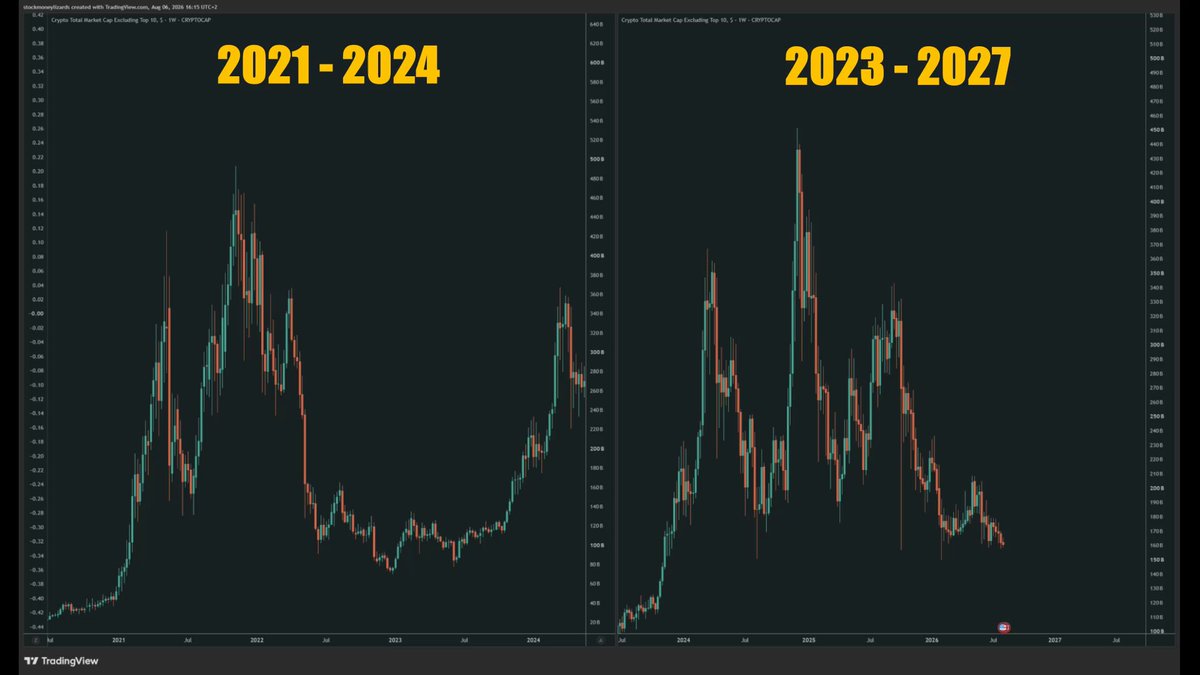
Altseason has been the story since 2024. Every rally someone calls it (including myself), and every time it dies.
What we actually got was a bear market. Long and painful, and it wore people down until they stopped talking about alts at all.
Now Altcoins are "dead".
That's usually the condition, not the sign to give up.
Bitcoin goes first. It has to put in its first real leg up before money rotates out into alts. That's the order it always happens in.
I'm looking at 2027 for that rotation. After BTC leads, once the altseason talk is long dead.
Slowly, then all at once. I scaled in a few Alts - too early, but I am ready to hold.
Not financial advice.
Max Favorable +0.9%Max Adverse −0.1%ACTIVE
ST
𝕏
Bitcoin - it all comes together
Indicators
Pattern
Timing
Uptober is coming near. 100k year-end https://t.co/Ttlr2RPosC

Max Favorable +0.1%Max Adverse −0.9%ACTIVE
ST
𝕏
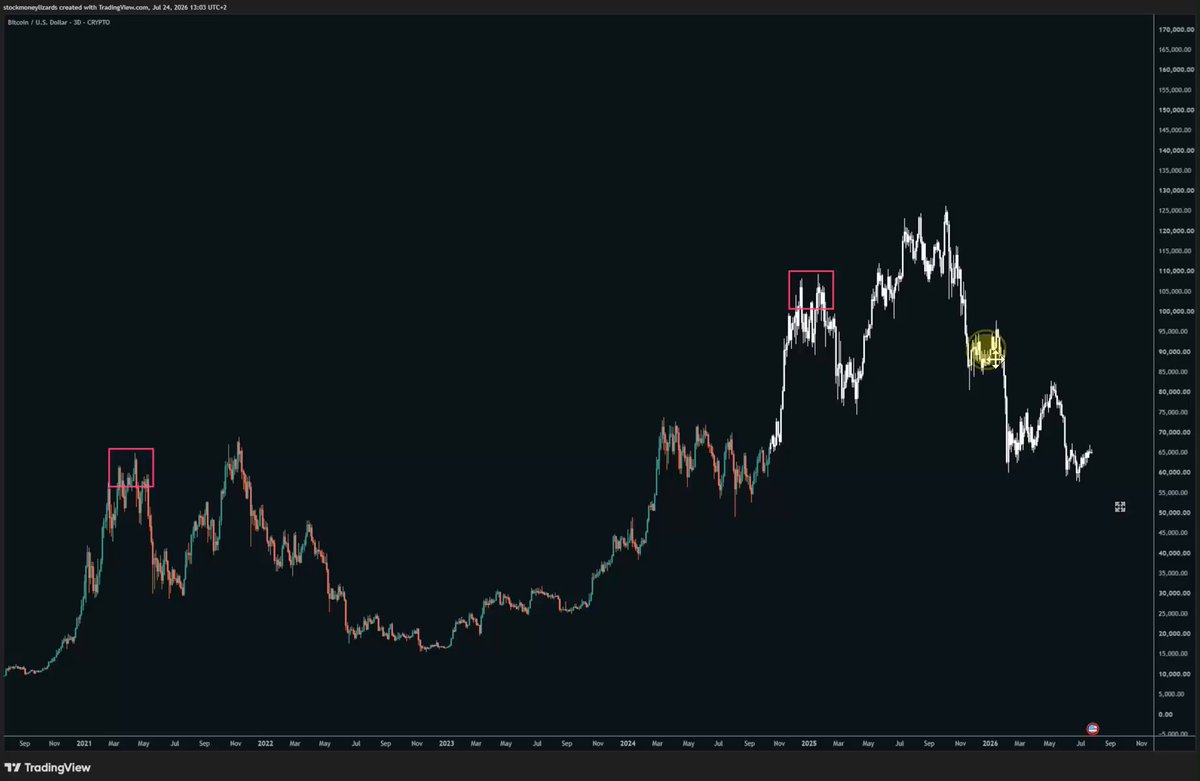
Bitcoin:
ignore those who tell you this time is different (both perma bulls and bears)
We have some chop left during summer. Q4 will be strong.
Accumulation is almost over. https://t.co/HfGZT8ZKUQ
Max Favorable +0.2%Max Adverse −1.7%ACTIVE
ST
𝕏
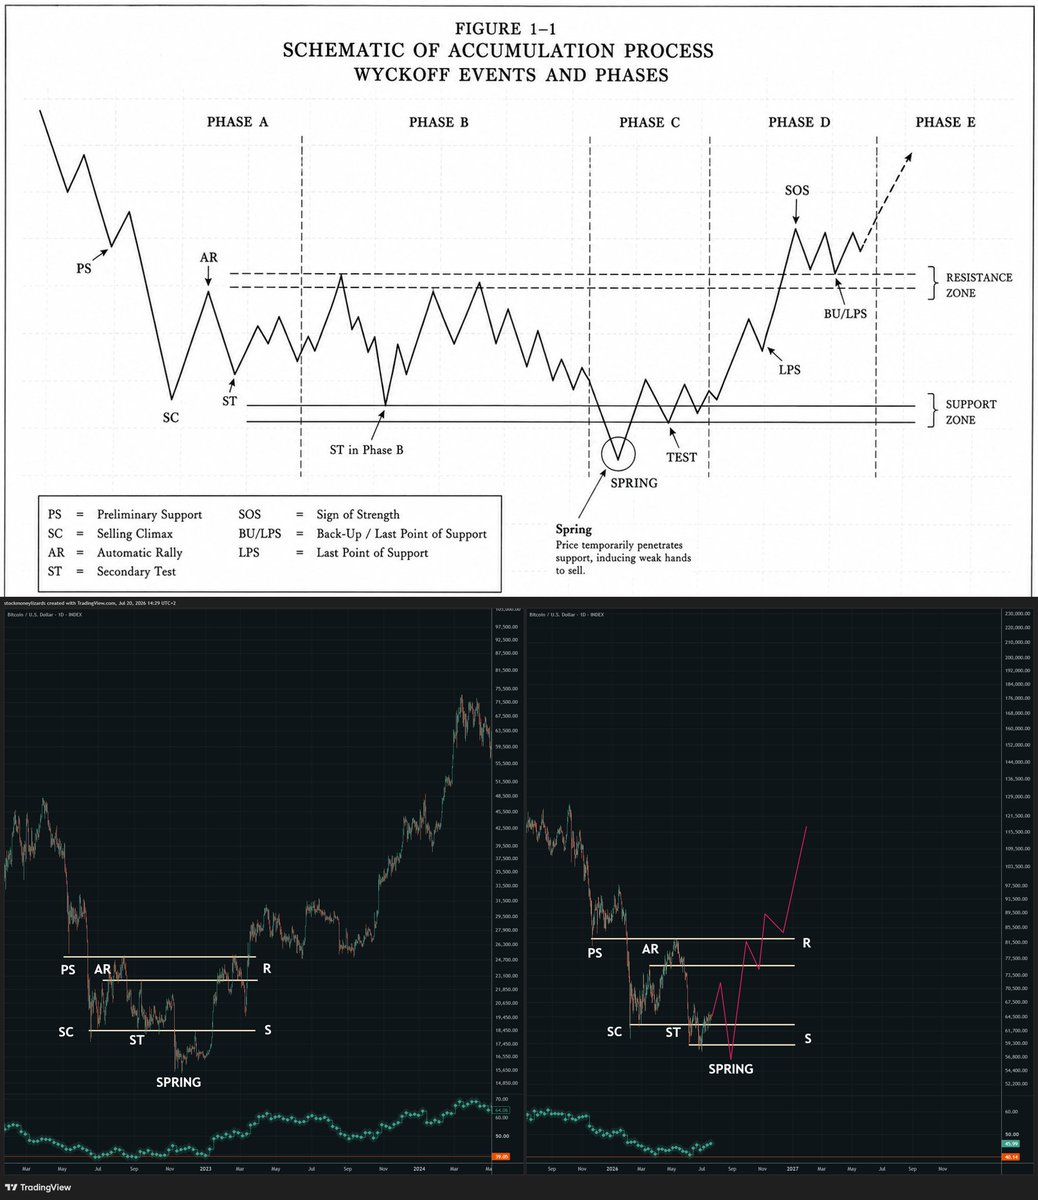
Bitcoin
Bottom phase.
100k on 31st December 2026. https://t.co/b97Js2VOHd
Max Favorable +1.5%Max Adverse −0.2%ACTIVE
ST
𝕏
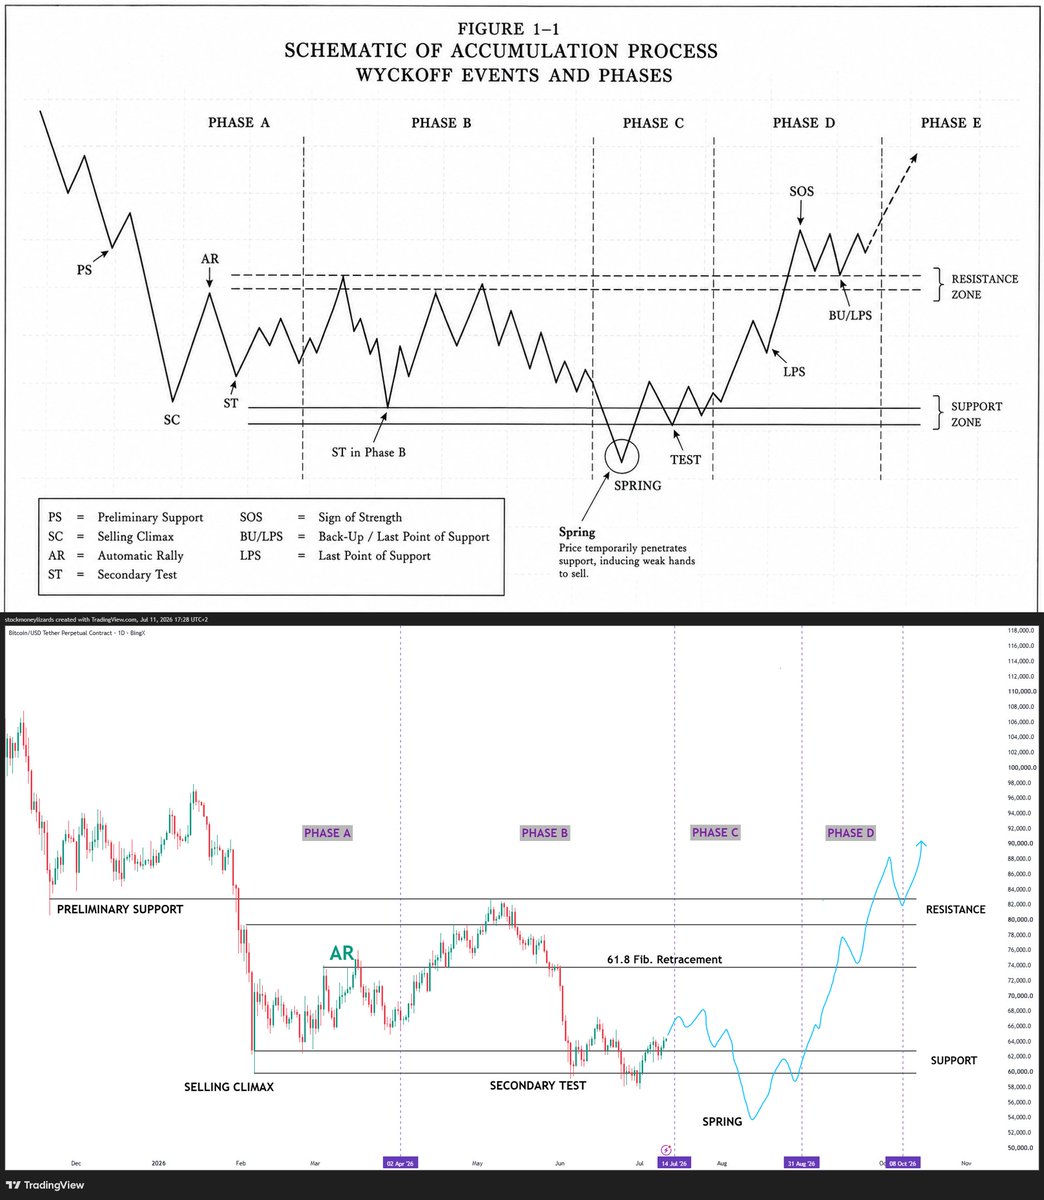
Bitcoin update.
Summer boredom and accumulation time.
Q4 = bull. https://t.co/p8XobMw3sH
Max Favorable +0.1%Max Adverse −1.1%ACTIVE
Scored Calls · Full Audit Trail
ST
𝕏
Bitcoin - Accumulation almost done.
Not financial advice. Personal opinion. https://t.co/mRQ9uigYcb

Max Favorable +0.1%Max Adverse −0.6%Opportunity 0.07Time 0.00Magnitude 0.07Score 0.04
ST
𝕏
Buy low, sell high. Everyone says it. Nobody does it.
Because buying low feels awful. Boring, grinding, chart looks dead, and CT is a ghost town.
That's what a bottom feels like from the inside. It never actually tells you so.
Bitcoin's been like this for 6 months. Boring, cheap, and annoying.
And ironically, this is the exact setup everyone begs for and hates when it shows up.
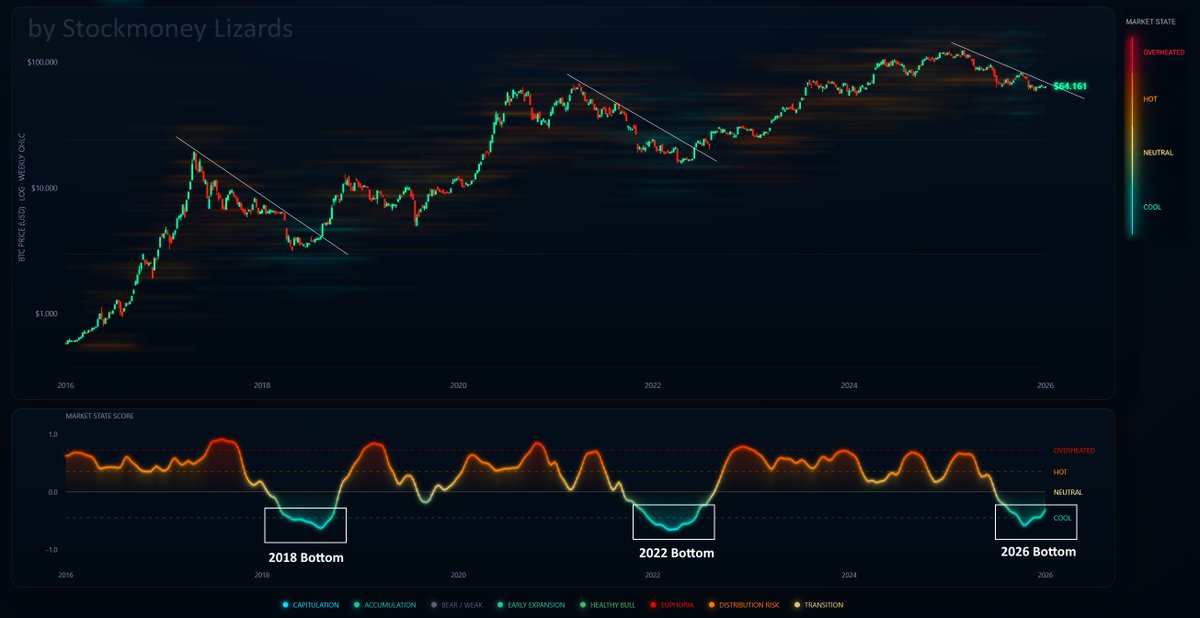
So I built something to measure it: the Market Heat Index.
One score, three signals: trend, network, stretch.
Fold them together, the fakeouts drop out and the real turns stay. Ten years of data.
Right now: we're slowly crawling up off the lows while price still looks like nothing.
We probably swipe these lows one more time first. 53k max pain on weekly close.
One last shakeout to clear the leverage.
But under the boring chart, something's already moving: Accumulation.
I bought here and it doesn't feel like it yet. But that's the whole point of it.
I'm still building it. Not financial advice.
Max Favorable +0.1%Max Adverse −0.2%Opportunity 0.07Time 0.00Magnitude 0.07Score 0.08
ST
𝕏
Buy low, sell high. Everyone says it. Nobody does it.
Because buying low feels awful. Boring, grinding, chart looks dead, everyone's gone.
That's what a bottom feels like from the inside. It never rings a bell.
Bitcoin's been like this two years. Boring. Cheap. Annoying.
The exact setup everyone begs for and hates when it shows up.
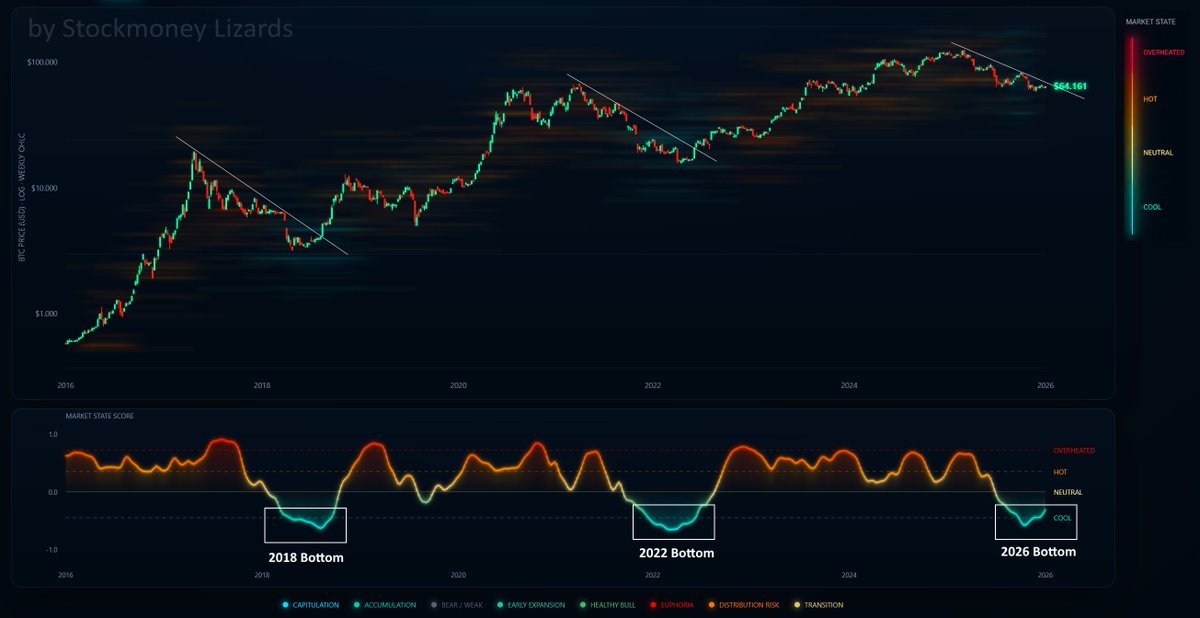
So I built something to measure it: the Market Heat Index.
One score, three signals: trend, network, stretch.
Fold them together, the fakeouts drop out and the real turns stay. Ten years of data.
Right now: creeping up off the lows while price still looks like nothing.
We probably swipe these lows one more time first. 53k max pain, weekly close.
One last shakeout to clear the leverage.
But under the boring chart, something's already moving.
Accumulation.
I bought here. Doesn't feel like it yet. That's the point.
Still building it. Not financial advice.
Max Favorable +0.1%Max Adverse −0.2%Opportunity 0.07Time 0.00Magnitude 0.07Score 0.08
ST
𝕏
Bitcoin is in tight compression range of the falling wedge, while being oversold. The days of this bear market are counted.
Background and invalidation points:
Bitcoin is oversold. Indicator: Chaikin money flow. The current extended Bottom structure follows a Wyckoff accumulation schematic, which I shared earlier.
Invalidation points: Support = 53k (weekly close)
A breakout above the descending upper wedge line would mean a definite trend reversal.

Max Favorable +0.0%Max Adverse −1.3%Opportunity 0.03Time 0.00Magnitude 0.03Score 0.01
ST
𝕏
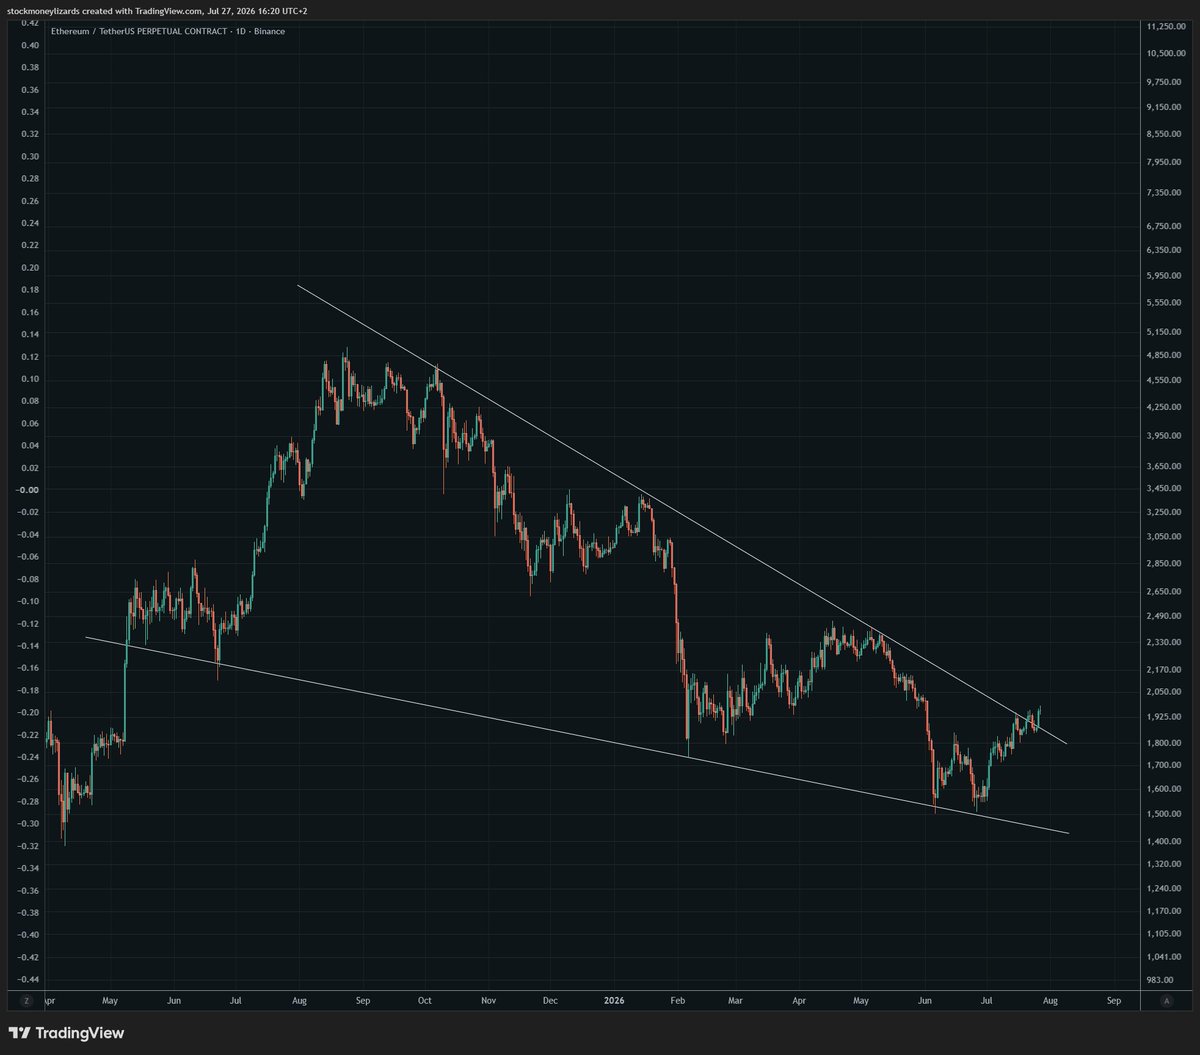
ETH breakout https://t.co/ZGxK4EgIgd
Max Favorable +0.6%Max Adverse −0.5%Opportunity 0.40Time 1.00Magnitude 0.40Score 0.50