@CryptoMichNL
“@CryptoMichNL sits at 49.5% accuracy across 1,710 calls, focusing heavily on mid-term BTC, ETH, and altcoin setups with a strong bullish lean (87% long calls). Short-term calls are their relative strength at 51.8%, and Break/Pump setups dominate their playbook with 492 calls — though accuracy across all horizons hovers near coin-flip territory.”
Score Breakdown
| CallRank Score | Move · Path · Time | Scored | |
|---|---|---|---|
| ALL-TIME | 49% | 0.62 · 0.47 · 0.44 | 1871 |
| YTD | 45% | 0.58 · 0.45 · 0.42 | 851 |
| 30D | — | — | 0 |
CallRank Score by Duration
Short term52% 434 calls
Medium term48% 1064 calls
Long term47% 373 calls
CallRank Score · Last 12 Months
Asset Breakdown — Top 5
| Asset | CallRank Score | Calls | 🟢 Bull · 🔴 Bear |
|---|---|---|---|
| BTC | 47% | 968 | 791 · 177 |
| ETH | 55% | 308 | 277 · 31 |
| NEAR | 61% | 72 | 70 · 2 |
| TAO | 56% | 66 | 63 · 3 |
| SUI | 50% | 52 | 51 · 1 |
Live Calls Summary · By Horizon
@CryptoMichNL's active forecasts grouped by horizon and asset. L = Long, S = Short, number = open call count.
Active assets for this forecaster:
| No assets selected | |
|---|---|
| ST | — |
| MT | — |
| LT | — |
ST = Short term · MT = Medium term · LT = Long term
Active Calls · 50 Live
CR
𝕏
It's not that hard: Buy the dip on assets which are gaining traction, including a narrative.
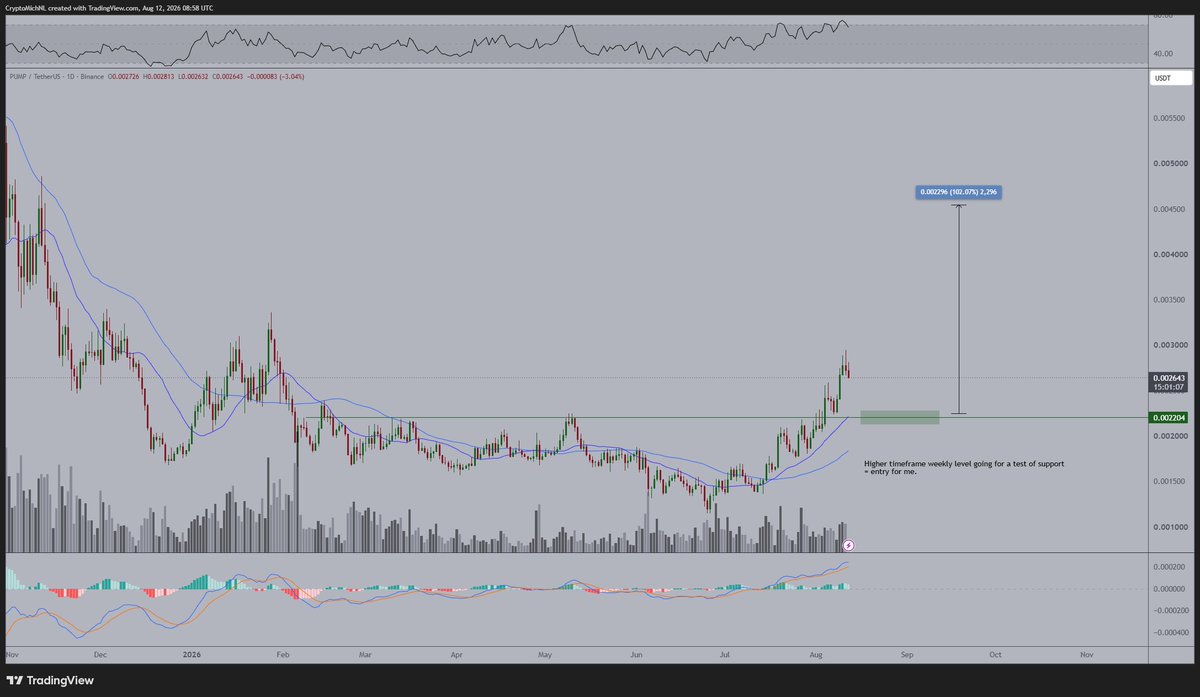
$HYPE has been one of those assets for almost a year, and $PUMP is just starting up.
I'm willing to be bidding the dip (if it comes) and looking to hold for a 80-120% return on this one.
Weekly level around $0.0022 seems the most optimal entry. Depending on market structure and willingness I might be bidding higher.
Potential targets? Everything north of $0.004.
PENDING TRIGGER
CR
𝕏
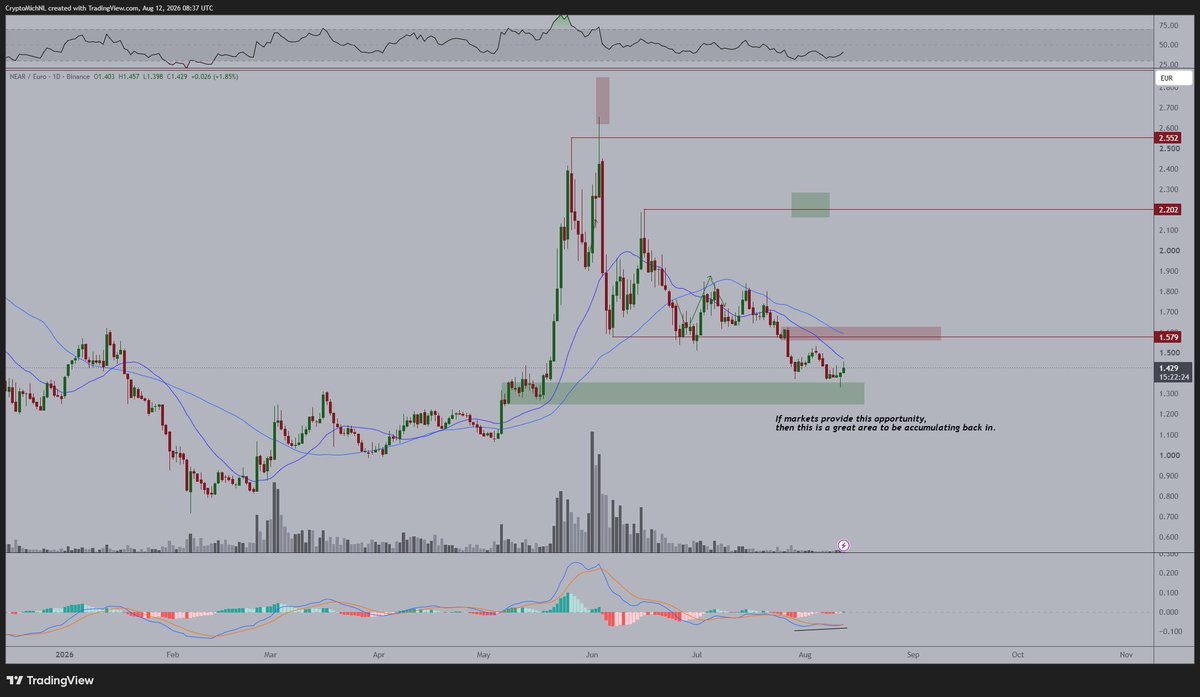
A strong move of $NEAR at this higher timeframe support level.
There's a bullish divergence on the MACD (although these remain to be slightly weaker than ones on the RSI).
In that sense, I expect to see a turn around of $NEAR here and I do think that we're at the end of the correction.
First real test: $1.85 area (or €1.60).
If that is being tested, we're printing a higher high and I'm bidding the higher low before this runs back to $2.40 (or €2).
I'm expecting to see a new high on $NEAR in Q4 of this year.
Max Favorable +1.6%Max Adverse −1.8%ACTIVE
CR
𝕏
I honestly think that $PUMP is at the start of a run as we've seen with $HYPE last year.
It's just starting up and that means three things:
- $PUMP is a no-brainer to add to everyone's portfolio for the foreseeable future.
- If you're an active trader, you'd want to be scalping on-chain. It's a ton of fun.
- $SOL is about to follow through, as the activity will most likely pick up there too.
Max Favorable +0.5%Max Adverse −3.6%ACTIVE
CR
𝕏
This is a pretty interesting weekly candle on $TAO.
It's on a higher timeframe support level.
In every of the previous cases, it has provided a rally of nearly 100% (or more).
I'm long again on this one and I expect to see continuation.
Coming weeks are defining.
Why?
➡️ The weekly green candle needs to be followed up with strength to increase the likelihood of the narrative.
➡️ The daily chart breaks above the 21-Day and 50-Day MA and needs to hold coming days in order to confirm the trend switch for the first time since May '26.
If those happen, we're going to continue and we might see $500 in Q4 2026 or Q1 2027.

Max Favorable +0.3%Max Adverse −3.1%ACTIVE
CR
𝕏
$BTC is ready for a breakout to atleast $73,700.
To me, there's one critical level to break.
That's the weekly level at $65,800.
When I'm looking at the charts, I don't think we'll test lower as the arguments are simply not there.
➡️ The MACD of multiple #Altcoins look similar and multiple of them have been breaking out.
That argument alone provides a strong case for Bitcoin to break upwards.
➡️ Strong bullish divergence on the 3-Day and 1-Week timeframe on the MACD.
➡️ Strong bullish divergence on the 3-Day and 1-Week timeframe on the RSI. Similarly to the 2022 bottom.
➡️ The long side liquidity has been taken multiple times and markets refuse to break downwards.
What targets does that give?
To me, there are two;
- $73,700
- $82,900
If the latter is tested, we're testing the 50-Week MA and are having the first bull market rally and are done with the bear market.
All in all, if $65,800 breaks (which is the crucial weekly level), I expect to see a volatile move upwards as short-side liquidity will be forced to move out of its position after this consolidation.

PENDING TRIGGER
Scored Calls · Full Audit Trail
CR
𝕏
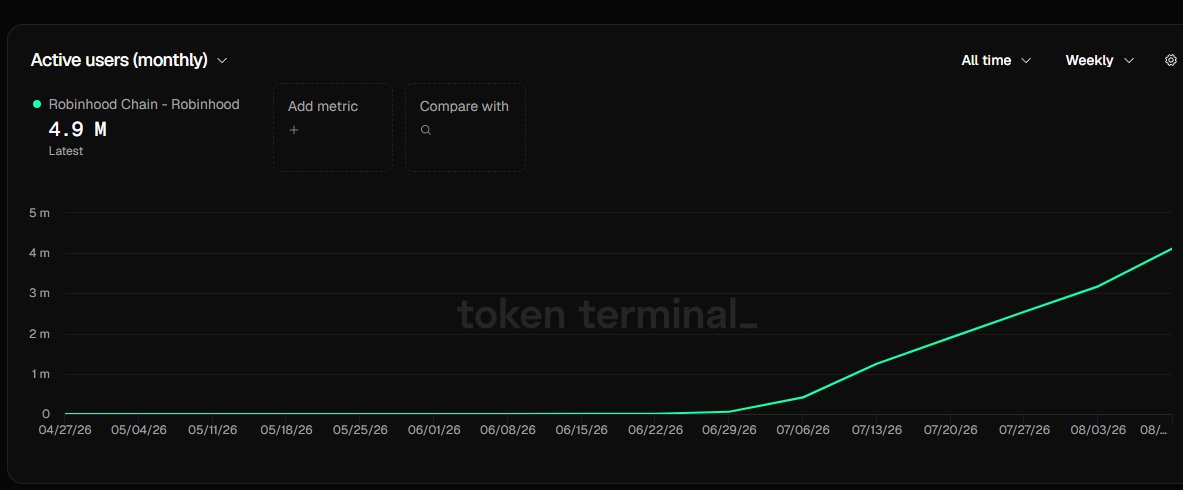
Robinhood Chain is killing it.
A few weeks ago, active users weekly: 300K
Currently: 1.9M and it's just wednesday.
An enormous amount of growth, as onchain activity has accelerated and people are looking to trade more.
Coins like $CASHCAT, $HMM, $ANSEM, $PONS are doing great.
What's the thesis for me?
Very simple:
➡️ Robinhood Chain wakes up the onchain activity and average #Crypto trader.
➡️ $PUMP becomes active again.
➡️ As a consequence, all DEXes on $SOL are going to be active again.
➡️ $SOL breaks out upwards, activating even more traders.
➡️ Other L1s like $SUI will follow the path.
➡️ We'll have a short window of momentum on the #Crypto markets dragging the rest along.
It's the first time in a long period I've seen this traction picking up momentum that's impressive and shows the demand for crypto.
Max Favorable +0.4%Max Adverse −0.4%Opportunity 0.35Time 1.00Magnitude 0.35Score 0.48
CR
𝕏
Robinhood Chain is killing it.
A few weeks ago, active users weekly: 300K
Currently: 1.9M and it's just wednesday.
An enormous amount of growth, as onchain activity has accelerated and people are looking to trade more.
Coins like $CASHCAT, $HMM, $ANSEM, $PONS are doing great.
What's the thesis for me?
Very simple:
➡️ Robinhood Chain wakes up the onchain activity and average #Crypto trader.
➡️ $PUMP becomes active again.
➡️ As a consequence, all DEXes on $SOL are going to be active again.
➡️ $SOL breaks out upwards, activating even more traders.
➡️ Other L1s like $SUI will follow the path.
➡️ We'll have a short window of momentum on the #Crypto markets dragging the rest along.
It's the first time in a long period I've seen this traction picking up momentum that's impressive and shows the demand for crypto.
Max Favorable +0.6%Max Adverse −0.1%Opportunity 0.51Time 1.00Magnitude 0.51Score 0.60
CR
𝕏
Robinhood Chain is killing it.
A few weeks ago, active users weekly: 300K
Currently: 1.9M and it's just wednesday.
An enormous amount of growth, as onchain activity has accelerated and people are looking to trade more.
Coins like $CASHCAT, $HMM, $ANSEM, $PONS are doing great.
What's the thesis for me?
Very simple:
➡️ Robinhood Chain wakes up the onchain activity and average #Crypto trader.
➡️ $PUMP becomes active again.
➡️ As a consequence, all DEXes on $SOL are going to be active again.
➡️ $SOL breaks out upwards, activating even more traders.
➡️ Other L1s like $SUI will follow the path.
➡️ We'll have a short window of momentum on the #Crypto markets dragging the rest along.
It's the first time in a long period I've seen this traction picking up momentum that's impressive and shows the demand for crypto.
Max Favorable +0.2%Max Adverse −1.7%Opportunity 0.06Time 0.00Magnitude 0.06Score 0.03
CR
𝕏
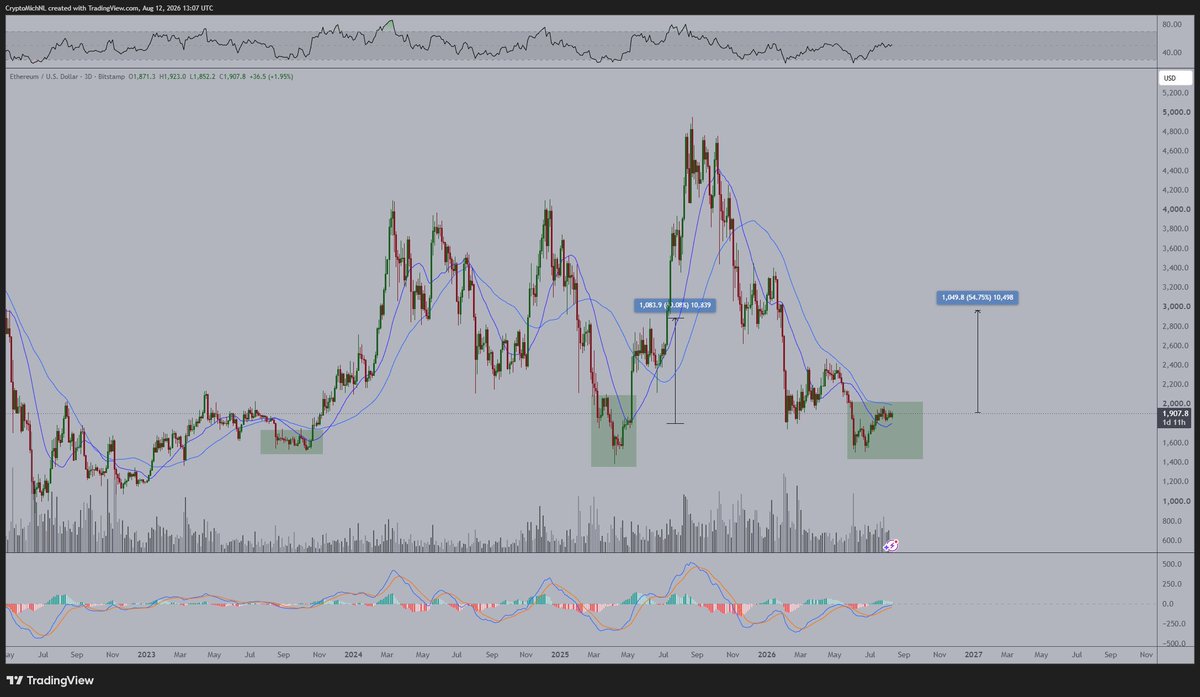
The ideal moment to be positioning yourself into $ETH is literally right now.
Everybody is waiting for that ultimate confirmation, but that never comes.
It's always awkward to be positioning yourself into a position as that's the purpose of the markets.
Previous breakouts of the markets have resulted into generally big returns as $ETH is known for volatile movements.
In that sense, last time a 60% breakout in less than a week took place. In 2023 the same has happened.
I wouldn't be surprised we're going to be seeing the exact same thing in the next months, a rally to $3,000 in a matter of days/week.
How are you going to position after that? Yes, that's quite hard.
That's why allocating here is the right strategy.
Max Favorable +0.2%Max Adverse −0.4%Opportunity 0.23Time 0.50Magnitude 0.23Score 0.27
CR
𝕏
I honestly think that $PUMP is at the start of a run as we've seen with $HYPE last year.
It's just starting up and that means three things:
- $PUMP is a no-brainer to add to everyone's portfolio for the foreseeable future.
- If you're an active trader, you'd want to be scalping on-chain. It's a ton of fun.
- $SOL is about to follow through, as the activity will most likely pick up there too.
Max Favorable +0.7%Max Adverse −0.6%Opportunity 0.55Time 1.00Magnitude 0.55Score 0.53