@0xnoncesense
“@0xnoncesense is a developing forecaster focused on BTC, ETH, and major-cap alts with a strong bullish bias, showing better accuracy on short- and mid-term calls (around 51%) than longer horizons. Their edge leans toward technical setups, particularly wick and liquidity grab calls, suggesting a price-action-oriented approach worth watching as their call volume grows.”
Score Breakdown
| CallRank Score | Move · Path · Time | Scored | |
|---|---|---|---|
| ALL-TIME | 48% | 0.63 · 0.44 · 0.44 | 109 |
| YTD | 41% | 0.57 · 0.40 · 0.37 | 38 |
| 30D | — | — | 0 |
CallRank Score by Duration
Short term51% 21 calls
Medium term51% 46 calls
Long term42% 42 calls
CallRank Score · Last 12 Months
Asset Breakdown — Top 5
| Asset | CallRank Score | Calls | 🟢 Bull · 🔴 Bear |
|---|---|---|---|
| BTC | 47% | 76 | 61 · 15 |
| ETH | 53% | 19 | 17 · 2 |
| SOL | 34% | 6 | 6 · 0 |
| BNB | 85% | 3 | 3 · 0 |
| DOGE | 29% | 2 | 2 · 0 |
Live Calls Summary · By Horizon
@0xnoncesense's active forecasts grouped by horizon and asset. L = Long, S = Short, number = open call count.
Active assets for this forecaster:
| No assets selected | |
|---|---|
| ST | — |
| MT | — |
| LT | — |
ST = Short term · MT = Medium term · LT = Long term
Active Calls · 9 Live
0X
𝕏
ETHEREUM IS SETTING THE FINAL TRAP BEFORE $4,500.
Thousands of traders drew the same $ETH chart.
They are all waiting for a final flush to $1,475 before they buy.
That flush is not coming.
The real shakeout already happened in June and July.
Two sweeps below the range. Both recovered within days. Nobody called it, because it was too quiet to feel like a bottom.
$ETH is $1,872 today.
What actually comes next:
October: a pullback to $1,537
That is the retest, and it is a higher low, not a new low
$2,203: reclaimed on the way up
$2,872: the range high, break it and the trend is confirmed
2027: $4,500
Full measured target: $4,500 to $4,700
So yes, buy the October dip.
Just understand it will be 15% higher than the price everyone in your replies is holding out for.
They will still be in cash at $2,800, waiting for $1,475.
The crowd never buys the bottom. It waits for a cheaper one that never comes.
I called the $126,190 Bitcoin top and the $15,768 bottom by reading price, not diagrams.
When I start buying, I post it here publicly, like I always do.
Follow and turn notifications on.

PENDING TRIGGER
0X
𝕏
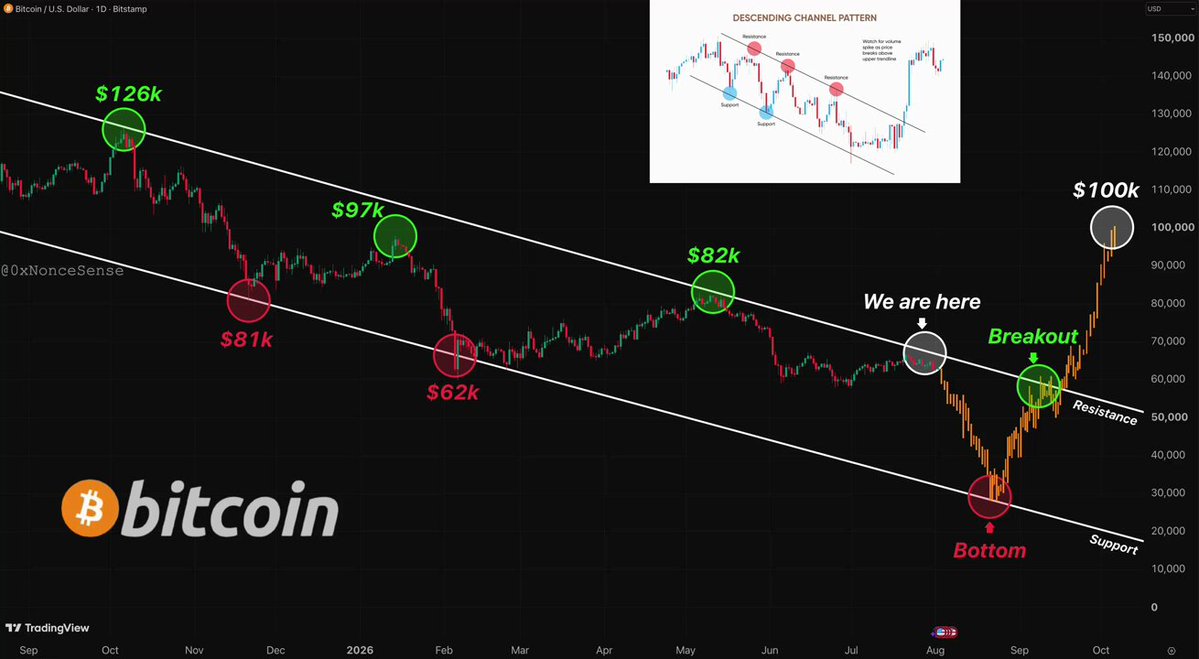
🚨 ONE MORE FLUSH TO $45K. THEN THE CYCLE TURNS.
Most people are positioned for the wrong move again.
The path from here:
- Rejection from $82K: done
- Flush into $58K: done
- Bounce toward $63K ← we are here
- Breakdown back through $55K
- Final flush into $45K
Bottom zone: $40K to $45K, October to November.
Then $65K in early 2027. Then $100K late 2027.
This bounce is not the recovery. It is the exit liquidity for it.
Every cycle low formed the exact same way:
2015: bounce, then the final low
2018: bounce, then $3,122
2022: bounce, then $15,768
Three cycles. Three last rallies. Three traps.
Every one of them convinced people the worst was over.
What looks like strength right now is the trap before the low.
Reminder: I called that $15,768 bottom and the $126,162 top.
The moment I make my first buy, I post it right here.
Follow and turn notifications on. You will see it first.
PENDING TRIGGER
0X
𝕏
🚨 ONE MORE FLUSH TO $45K. THEN THE CYCLE TURNS.
Most people are positioned for the wrong move again.
The path from here:
- Rejection from $82K: done
- Flush into $58K: done
- Bounce toward $63K ← we are here
- Breakdown back through $55K
- Final flush into $45K
Bottom zone: $40K to $45K, October to November.
Then $65K in early 2027. Then $100K late 2027.
This bounce is not the recovery. It is the exit liquidity for it.
Every cycle low formed the exact same way:
2015: bounce, then the final low
2018: bounce, then $3,122
2022: bounce, then $15,768
Three cycles. Three last rallies. Three traps.
Every one of them convinced people the worst was over.
What looks like strength right now is the trap before the low.
Reminder: I called that $15,768 bottom and the $126,162 top.
The moment I make my first buy, I post it right here.
Follow and turn notifications on. You will see it first.
Max Favorable +0.1%Max Adverse −0.8%ACTIVE
0X
𝕏
ETHEREUM IS SETTING THE FINAL TRAP BEFORE $7,000.
$ETH hit $1,920 exactly as planned.
The next magnet is $2,000.
That move will look bullish.
It is not.
That is where the trap starts.
My Ethereum roadmap is still clear:
1. $1,800 gets tested first.
2. $2,000 gets tagged next.
3. $2,200 comes if BTC hits $70K.
4. 7 to 10 days of distribution.
5. Final bottom zone: $1,300 to $900.
6. Then the new bull cycle begins.
Target remains $7,000.
Most people will buy the wrong part of this move.
They will call $2,000 strength.
They will call $2,200 confirmation.
I call it exit liquidity.
The real buy zone is not here.
It is $1,300 to $900.
That is where I want ETH.
That is where the crowd will be too scared to touch it.
A wick into the 2022 low zone is still possible.
That will not kill the trend.
It will complete the reset.
Ethereum hate was part of the setup.
It forced retail out before the real opportunity.
The same voices will flip bullish later.
But only after ETH is already far above them.
I warned about the $82K bull trap before it broke.
I warned about the summer drop before it started.
The next call is the biggest one of this cycle.
Turn notifications on before ETH enters the final zone.
Most people will follow too late.

PENDING TRIGGER
0X
𝕏
ETHEREUM IS SETTING THE FINAL TRAP BEFORE $7,000.
$ETH hit $1,920 exactly as planned.
The next magnet is $2,000.
That move will look bullish.
It is not.
That is where the trap starts.
My Ethereum roadmap is still clear:
1. $1,800 gets tested first.
2. $2,000 gets tagged next.
3. $2,200 comes if BTC hits $70K.
4. 7 to 10 days of distribution.
5. Final bottom zone: $1,300 to $900.
6. Then the new bull cycle begins.
Target remains $7,000.
Most people will buy the wrong part of this move.
They will call $2,000 strength.
They will call $2,200 confirmation.
I call it exit liquidity.
The real buy zone is not here.
It is $1,300 to $900.
That is where I want ETH.
That is where the crowd will be too scared to touch it.
A wick into the 2022 low zone is still possible.
That will not kill the trend.
It will complete the reset.
Ethereum hate was part of the setup.
It forced retail out before the real opportunity.
The same voices will flip bullish later.
But only after ETH is already far above them.
I warned about the $82K bull trap before it broke.
I warned about the summer drop before it started.
The next call is the biggest one of this cycle.
Turn notifications on before ETH enters the final zone.
Most people will follow too late.
Max Favorable +0.7%Max Adverse −4.8%ACTIVE
Scored Calls · Full Audit Trail
0X
𝕏
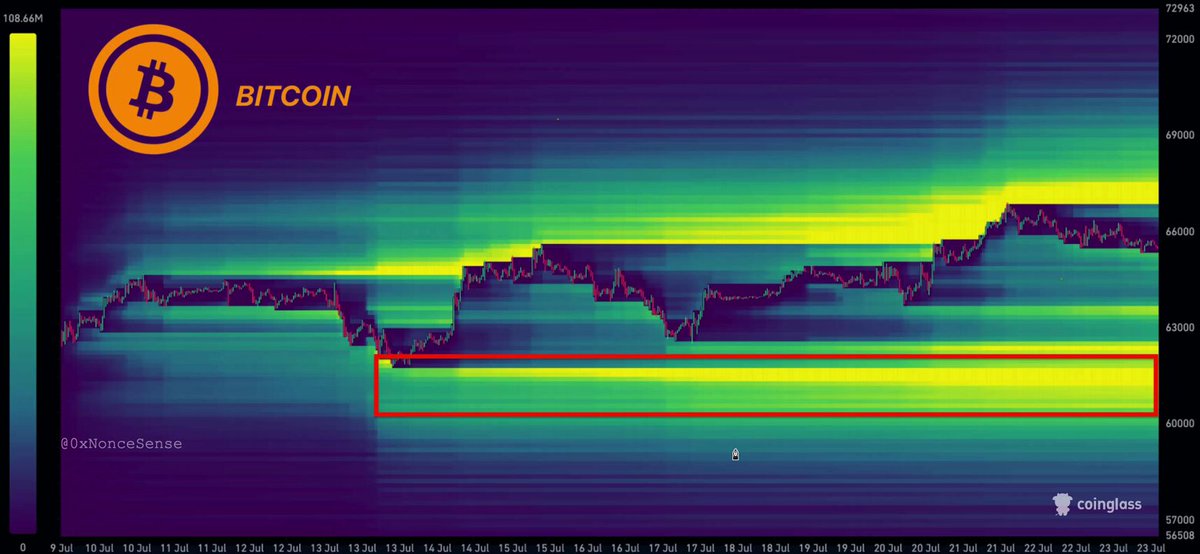
🚨 BTC IS SETTING UP FOR PULLBACK
Price just swept the $64K–$66K liquidity zone.
There’s still liquidity sitting higher at $67K, where a lot of 10x short orders are stacked.
The real liquidity still sits lower, around $60-62K.
One more push higher before the real move starts.
Watch liquidity, not price.
Turn on notifications. Most people will follow me too late.
Max Favorable +1.4%Max Adverse −4.1%Opportunity 0.65Time 0.12Magnitude 0.65Score 0.28
0X
𝕏
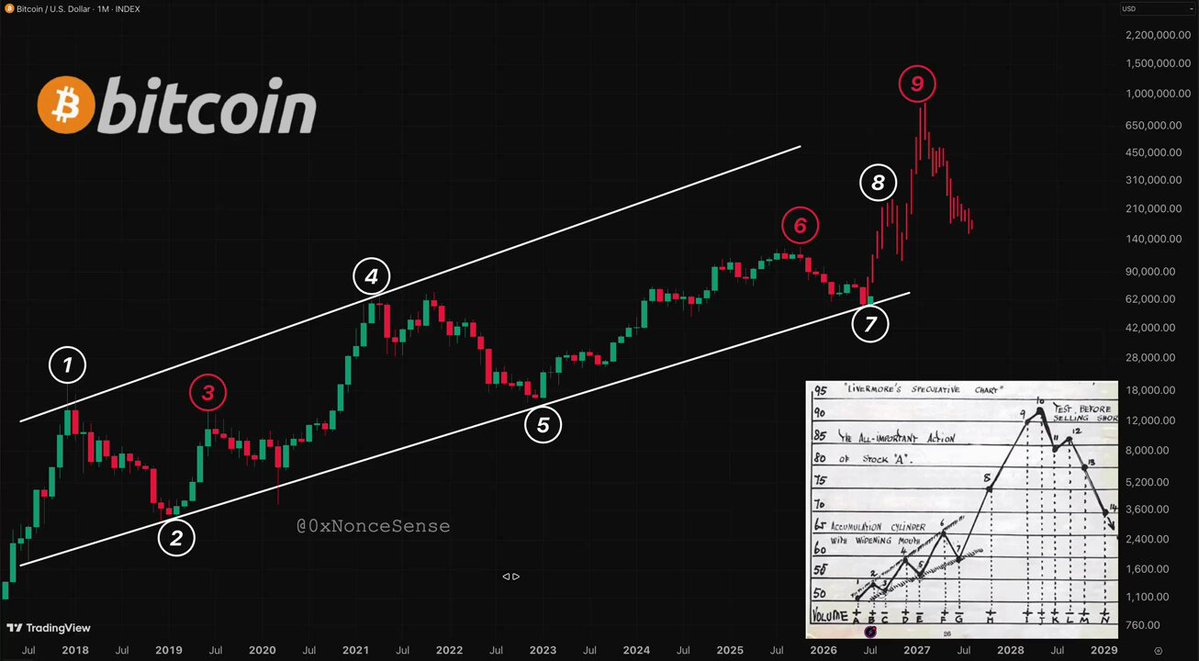
Bitcoin is stuck at $65K–$63K for a reason.
The bulltrap is almost over.
Next week, BTC dumps to $55K.
After that, the 2026 pattern is simple:
$65K → $55K → $45K → $55K → $130K
Next targets:
→ $55K in days
→ $45K by August
Reminder: I called the $16K Bitcoin bottom and the $126K top.
The next call is coming. My followers will see it first.
Follow and turn notifications on.
Most people will follow me too late.
Max Favorable +4.0%Max Adverse −2.9%Opportunity 0.41Time 0.73Magnitude 0.41Score 0.49
0X
𝕏
Bitcoin is stuck at $65K–$63K for a reason.
The bulltrap is almost over.
Next week, BTC dumps to $55K.
After that, the 2026 pattern is simple:
$65K → $55K → $45K → $55K → $130K
Next targets:
→ $55K in days
→ $45K by August
Reminder: I called the $16K Bitcoin bottom and the $126K top.
The next call is coming. My followers will see it first.
Follow and turn notifications on.
Most people will follow me too late.
Max Favorable +3.9%Max Adverse −2.9%Opportunity 0.79Time 0.67Magnitude 0.79Score 0.60
0X
𝕏
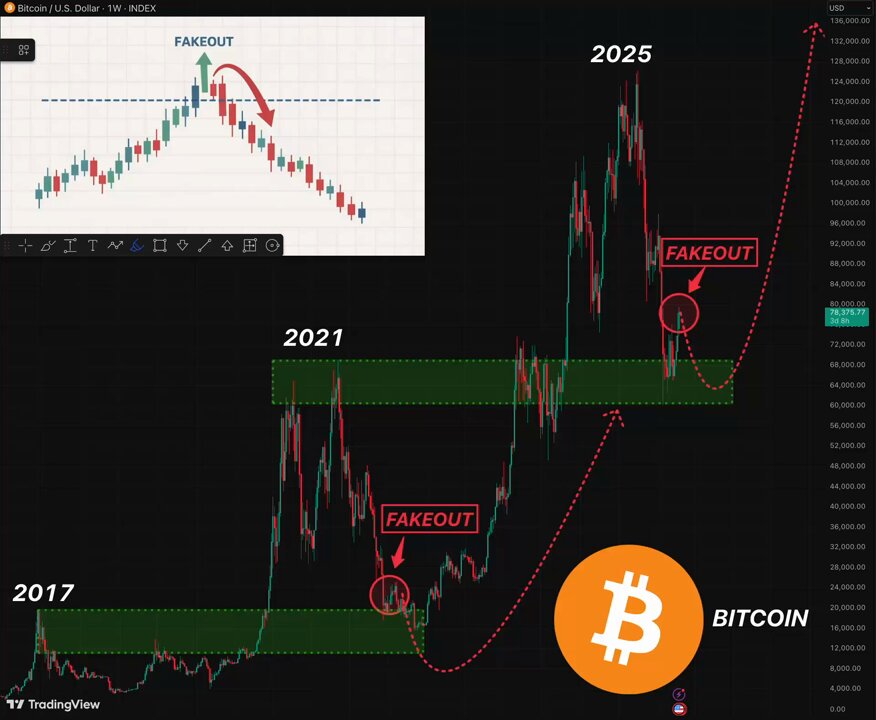
Bitcoin did this TWICE already.
2017: ATH taken → dump → fakeout → bottom
2021: ATH taken → dump → fakeout → bottom
2025: ATH taken → dump → fakeout NOW
That drop is where most people exit.
The real move usually starts right after.
Just to remind you, I was the only one who called the last cycle bottom and top.
Turn notifications on. Most people will follow me too late.
Max Favorable +5.8%Max Adverse −26.2%Opportunity 0.43Time 0.15Magnitude 0.43Score 0.23
0X
𝕏
🚨 BTC IS SETTING UP FOR PULLBACK
Price just swept the $75K–$77K liquidity zone.
$550M in shorts got wiped out.
That move is done.
There’s still liquidity sitting higher at $77K–$80K, where a lot of 10x short orders are stacked.
The real liquidity still sits lower, around $70K.
One more push higher before the real move starts.
Watch liquidity, not price.
Turn on notifications. Most people will follow me too late.

Max Favorable +19.9%Max Adverse −3.6%Opportunity 0.80Time 0.71Magnitude 0.80Score 0.77