@killaxbt
“@killaxbt sits at 52.8% accuracy across 797 calls, focusing primarily on mid-term setups across BTC, ETH, and SOL with a balanced long/short approach. Their edge sharpens at longer horizons—61.1% accuracy on long-term calls—and they specialize in Wick/Liquidity Grab setups (206 calls), suggesting a structural read on market manipulation zones.”
Score Breakdown
| CallRank Score | Move · Path · Time | Scored | |
|---|---|---|---|
| ALL-TIME | 52% | 0.64 · 0.53 · 0.54 | 840 |
| YTD | 53% | 0.63 · 0.55 · 0.55 | 326 |
| 30D | — | — | 0 |
CallRank Score by Duration
Short term45% 172 calls
Medium term53% 553 calls
Long term59% 115 calls
CallRank Score · Last 12 Months
Asset Breakdown — Top 5
| Asset | CallRank Score | Calls | 🟢 Bull · 🔴 Bear |
|---|---|---|---|
| BTC | 52% | 786 | 404 · 382 |
| ETH | 51% | 21 | 12 · 9 |
| SOL | 54% | 19 | 8 · 11 |
| LTC | 48% | 4 | 2 · 2 |
| XRP | 70% | 2 | 0 · 2 |
Live Calls Summary · By Horizon
@killaxbt's active forecasts grouped by horizon and asset. L = Long, S = Short, number = open call count.
Active assets for this forecaster:
| No assets selected | |
|---|---|
| ST | — |
| MT | — |
| LT | — |
ST = Short term · MT = Medium term · LT = Long term
Active Calls · 39 Live
KI
𝕏
This is literally going to be the best buy of the decade.
Everyone’s pivoting to AI, and it’s going to be hilarious watching $BTC rip faces off a few years from now.
And remember, come 2029, the people pivoting to AI will be buying above 0.16M per coin. https://t.co/o83Lg6LtnJ

Max Favorable +0.1%Max Adverse −0.3%ACTIVE
KI
𝕏
If we happen to test below this line,
You buy as much $BTC as you possibly fucking can.
I’ve already mentioned numerous times that I have major allocations in spot & my 2X long. If we happen to get a wick below this low, I will officially be 100% in the markets. Maximum risk.
Don’t be that guy full of regret 2–3y from now.

PENDING TRIGGER
KI
𝕏
Words genuinely cannot describe how excited I am for the next 2 years.
Swing longs. Continuation longs. Range longs... $BTC
After spending the last 9 months positioned as a bear, I’m more than ready for the other side of the cycle.
An asset can only fall 99.9%.
We’re already seeing clear divergence in seller strength.
Sellers are gradually losing momentum. 2 months left.
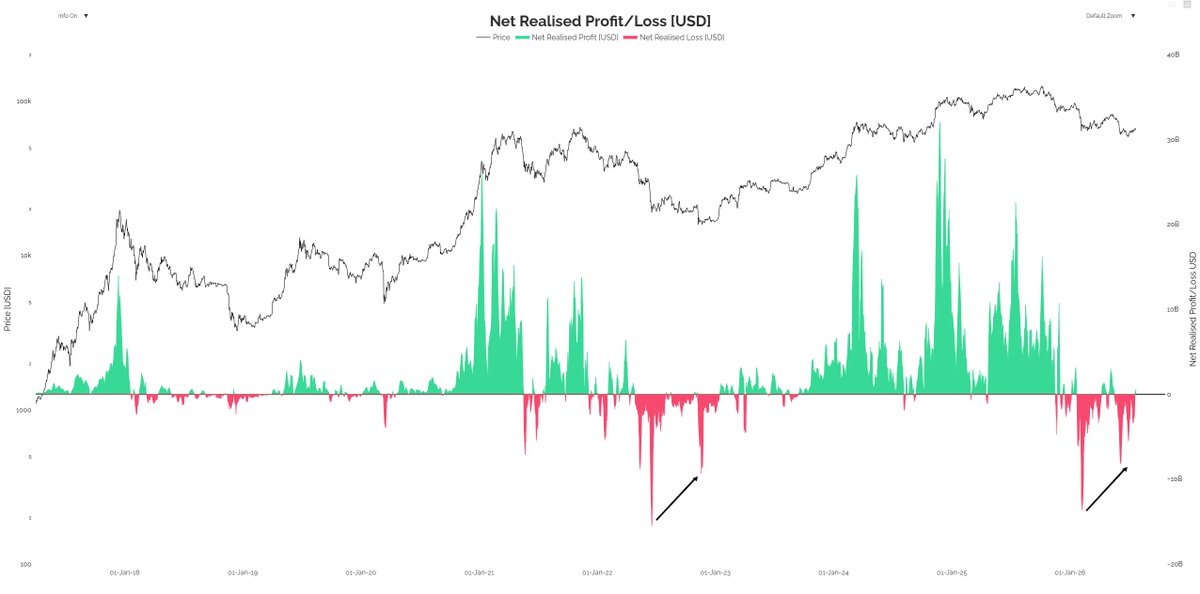
Max Favorable +0.5%Max Adverse −0.1%ACTIVE
KI
𝕏
Has everyone suddenly forgotten that $BTC made a new ATH before the halving last cycle?
Have people forgotten that we reached a new ATH just 476 days after the bottom? Significantly faster than the previous 2 cycles?
The cycle has accelerated.
I expect the same thing to happen again.
$BTC will make a new ATH pre-halving this cycle as well.
Which means bottoms will form quicker & so will tops.
Seasonality works until it doesn't.
We weren’t supposed to break the ATH pre-halving based on historical seasonality, yet we did.
We were supposed to top in November–December based on seasonality, yet the cycle topped just days into October.
Cycles don’t follow a perfect script, so expecting the timing to mirror previous cycles perfectly is unreasonable, especially when subtle signs are already suggesting otherwise.
Few understand.

Max Favorable +0.2%Max Adverse −0.4%ACTIVE
KI
𝕏
Buying $BTC now is like buying it at $19K last cycle.
I can assure you, no billionaire or multi millionaire is trying to catch the peak bottom.
These fuckers simply market buy. https://t.co/OJZj4llUyS

Max Favorable +0.1%Max Adverse −0.5%ACTIVE
Scored Calls · Full Audit Trail
KI
𝕏
$BTC
Delta has remained green for months, which clearly suggests that larger players have been steadily accumulating.
It’s only a matter of time before we transition back into orange and begin seeing a much larger move upwards.
Paytience. 🤟 https://t.co/ojKt1buxKA
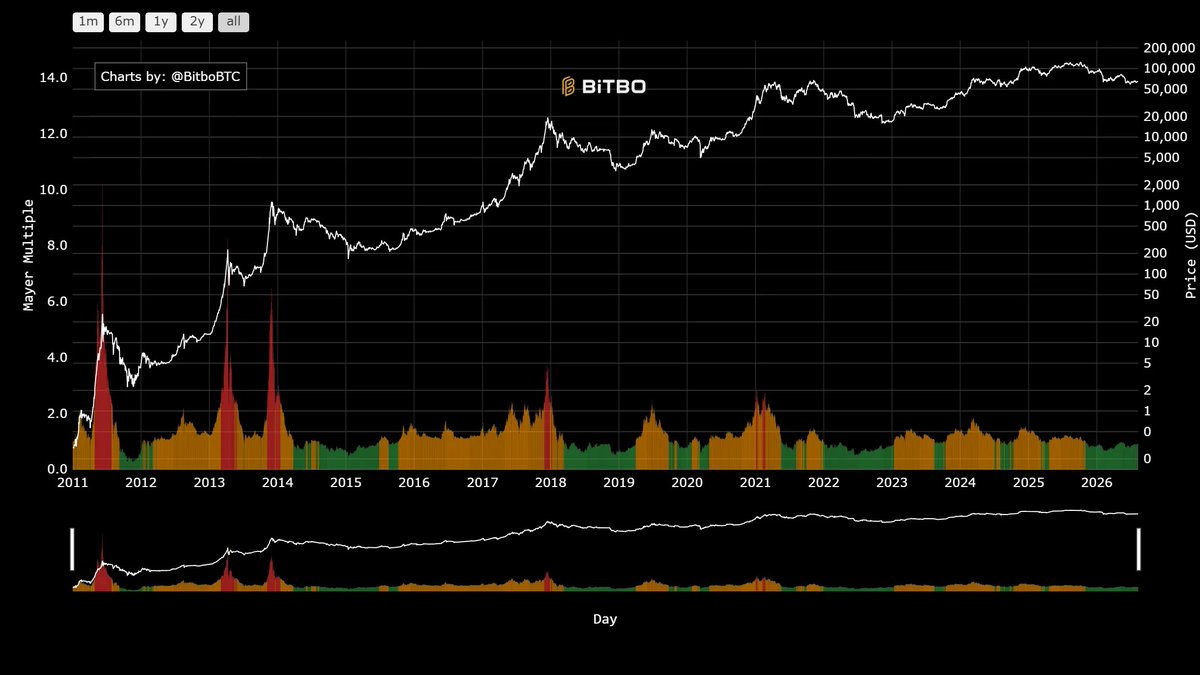
Max Favorable +0.1%Max Adverse −1.7%Opportunity 0.17Time 0.00Magnitude 0.17Score 0.06
KI
𝕏
It’s not complicated
Buy the blood... $BTC
I’ll be the only bull left standing if that’s what it takes.
I’ve been publicly short this entire 50% drop… and only now, after many months I am finally long.
Don't confuse me for a perma bull or a perma bear. I simply switch sides when the market tells me to.

Max Favorable +0.2%Max Adverse −0.6%Opportunity 0.21Time 0.00Magnitude 0.21Score 0.11
KI
𝕏
There are only 2 scenarios for $BTC.
Either we're in the process of a failed breakout, or the failed breakout already happened and the bottom is in.
You already know my positioning,
2x swing long + full spot allocation.
I'm not cutting it this close for a 10% better entry. https://t.co/5nltm2qxaX

Max Favorable +0.3%Max Adverse −0.4%Opportunity 0.30Time 0.00Magnitude 0.30Score 0.18
KI
𝕏
$BTC
We're seeing the exact same bullish divergence on the daily that we saw back in 2022.
Almost every major confluence is suggesting the bottom could already be in.
The only thing making people hesitate is that we're not in Q4. Other than that, BTC is 100% in the manipulation phase, identical to what we saw back in 2022.
The similarities are hard to ignore.

Max Favorable +0.8%Max Adverse −0.6%Opportunity 0.54Time 1.00Magnitude 0.54Score 0.54
KI
𝕏
"I'm going to buy $BTC bottom in Q4"
People are cutting it a bit close, aren't they?
Hopefully this puts things into perspective as to why I'd rather be bullish now than wait for the "perfect" entry. https://t.co/1qRxUt6nJj
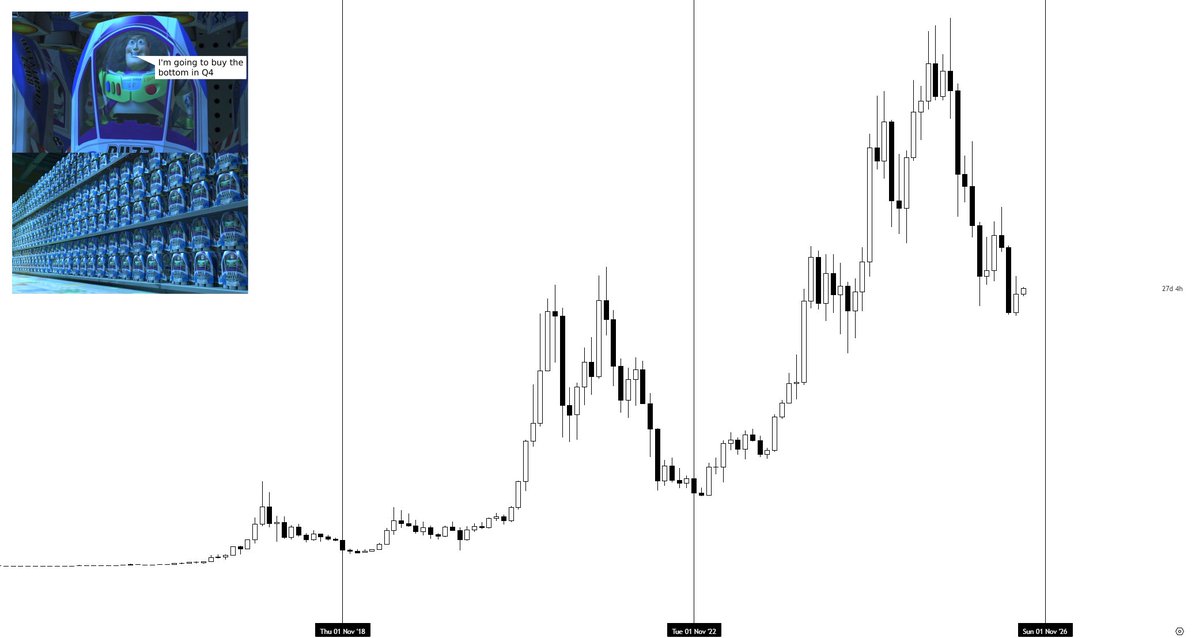
Max Favorable +0.6%Max Adverse −0.4%Opportunity 0.51Time 0.50Magnitude 0.51Score 0.41