@cryptoinsightuk
“@cryptoinsightuk posts predominantly bullish calls across XRP, BTC, ETH, and DOGE, with short-term horizons being their strongest timeframe at 55.0% accuracy. Their edge lies in Break/Pump and Wick/Liquidity grab setups, which together make up the bulk of their call types and reflect a pattern-based, momentum-oriented approach.”
Score Breakdown
| CallRank Score | Move · Path · Time | Scored | |
|---|---|---|---|
| ALL-TIME | 48% | 0.65 · 0.42 · 0.41 | 394 |
| YTD | 43% | 0.60 · 0.40 · 0.36 | 131 |
| 30D | — | — | 0 |
CallRank Score by Duration
Short term54% 92 calls
Medium term47% 215 calls
Long term45% 87 calls
CallRank Score · Last 12 Months
Asset Breakdown — Top 5
| Asset | CallRank Score | Calls | 🟢 Bull · 🔴 Bear |
|---|---|---|---|
| XRP | 48% | 187 | 174 · 13 |
| BTC | 45% | 92 | 71 · 21 |
| ETH | 56% | 29 | 20 · 9 |
| DOGE | 44% | 17 | 16 · 1 |
| ENA | 75% | 8 | 8 · 0 |
Live Calls Summary · By Horizon
@cryptoinsightuk's active forecasts grouped by horizon and asset. L = Long, S = Short, number = open call count.
Active assets for this forecaster:
| No assets selected | |
|---|---|
| ST | — |
| MT | — |
| LT | — |
ST = Short term · MT = Medium term · LT = Long term
Active Calls · 11 Live
CR
𝕏
No YouTube today folks.
I think there is a major rally coming for crypto very very soon.
I am unsure whether we flush downside liquidity for ripple:native first or not.
If we do, I'll be grateful to fill my leverage positions, if not I'm happy in spot.
First area to watch is $1.40, then $1.80.
Unsure exactly when this is coming, but it is.
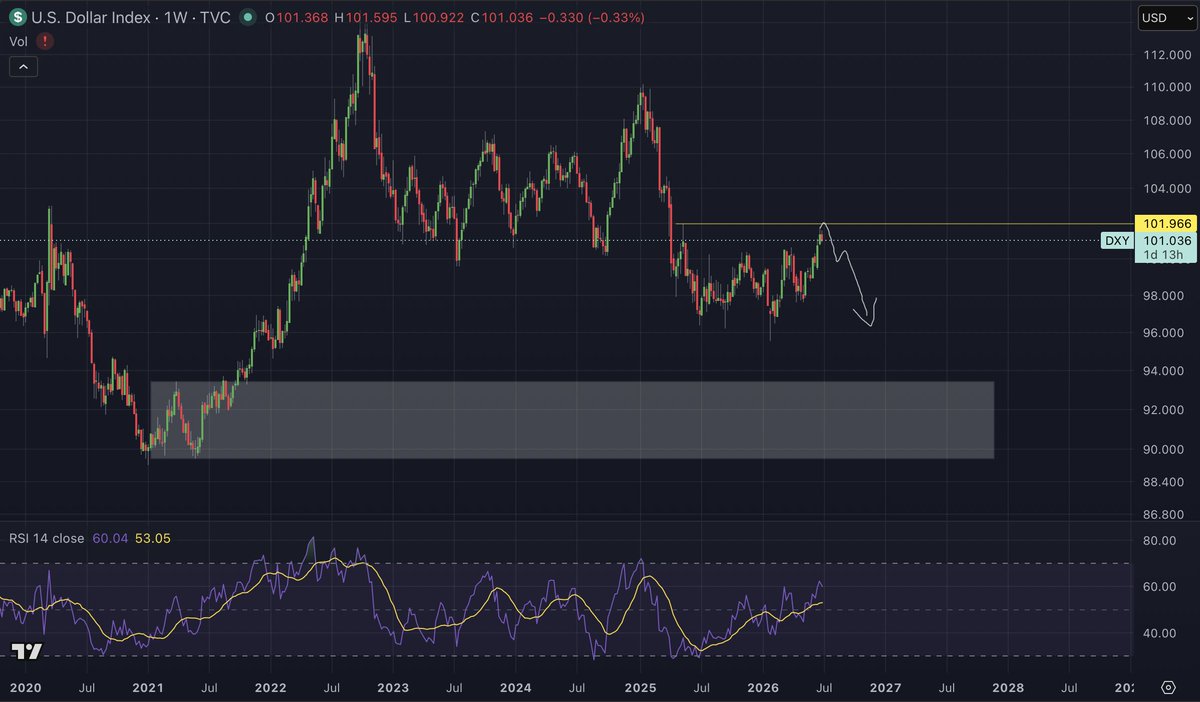
Now, we look around at the macro and the $DXY is at a yearly high and $USD / $PJY at 40 year resistance. This could have some huge effects on markets if the powers that be let this create cracks. They may ( and we could see some crazy volatility), they may not (we just pump from here).
This basically sums up what I'm watching and thinking.
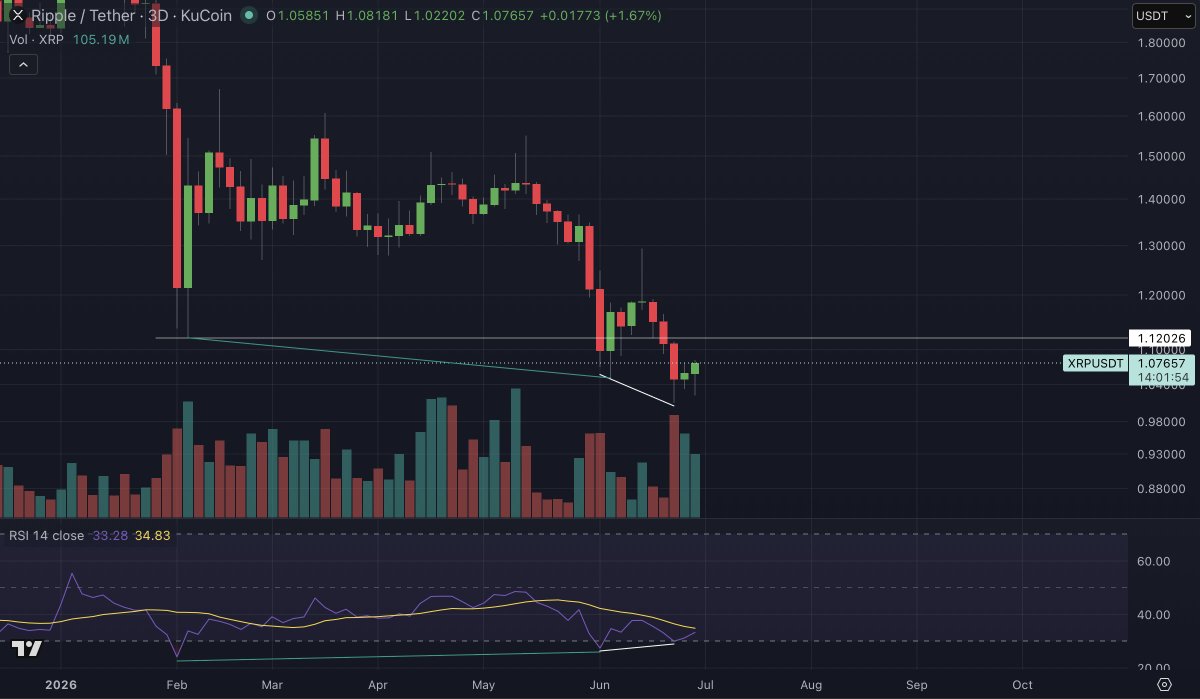
Most major cryptos have bullish divergences on the 4HR, Daily, 3 Day and the weekly.
If you look at ripple:native specifically, it is the most oversold it's ever been on the weekly and the monthly timeframe.
Change is coming, change is imminent. Don't get caught up in the doom posting. Bid the coins you like, shut your laptop and 6 months to a year from now you'll have seen 100% minimum (probably much much more tbh) on majors.
That's what I think, that's where we are.


Max Favorable +10.2%Max Adverse −0.2%ACTIVE
CR
𝕏
ripple:native 2 Week RSI is the most oversold in history.
Forget your emotions, this is a historic opportunity. https://t.co/xHcHJqvssd

Max Favorable +12.1%Max Adverse −12.6%ACTIVE
CR
𝕏
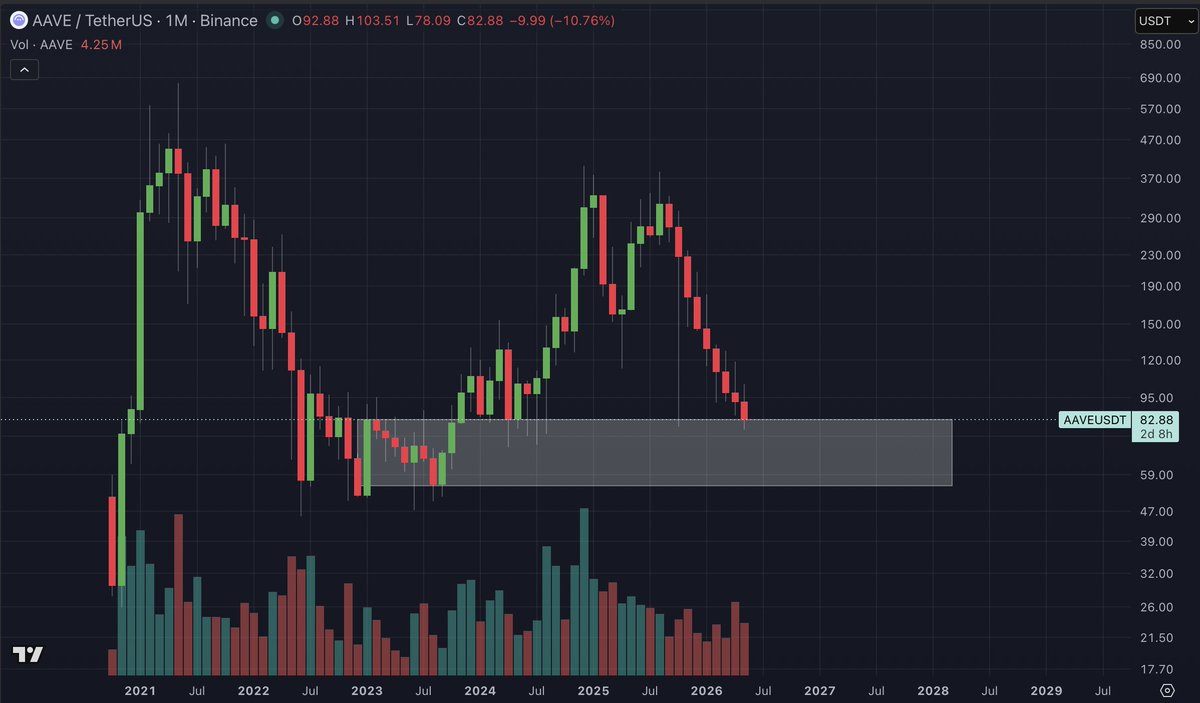
ethereum:0x7fc66500c84a76ad7e9c93437bfc5ac33e2ddae9 looks like a bid here on the monthly https://t.co/8m6RF8TQww
Max Favorable +19.5%Max Adverse −30.4%ACTIVE
CR
𝕏
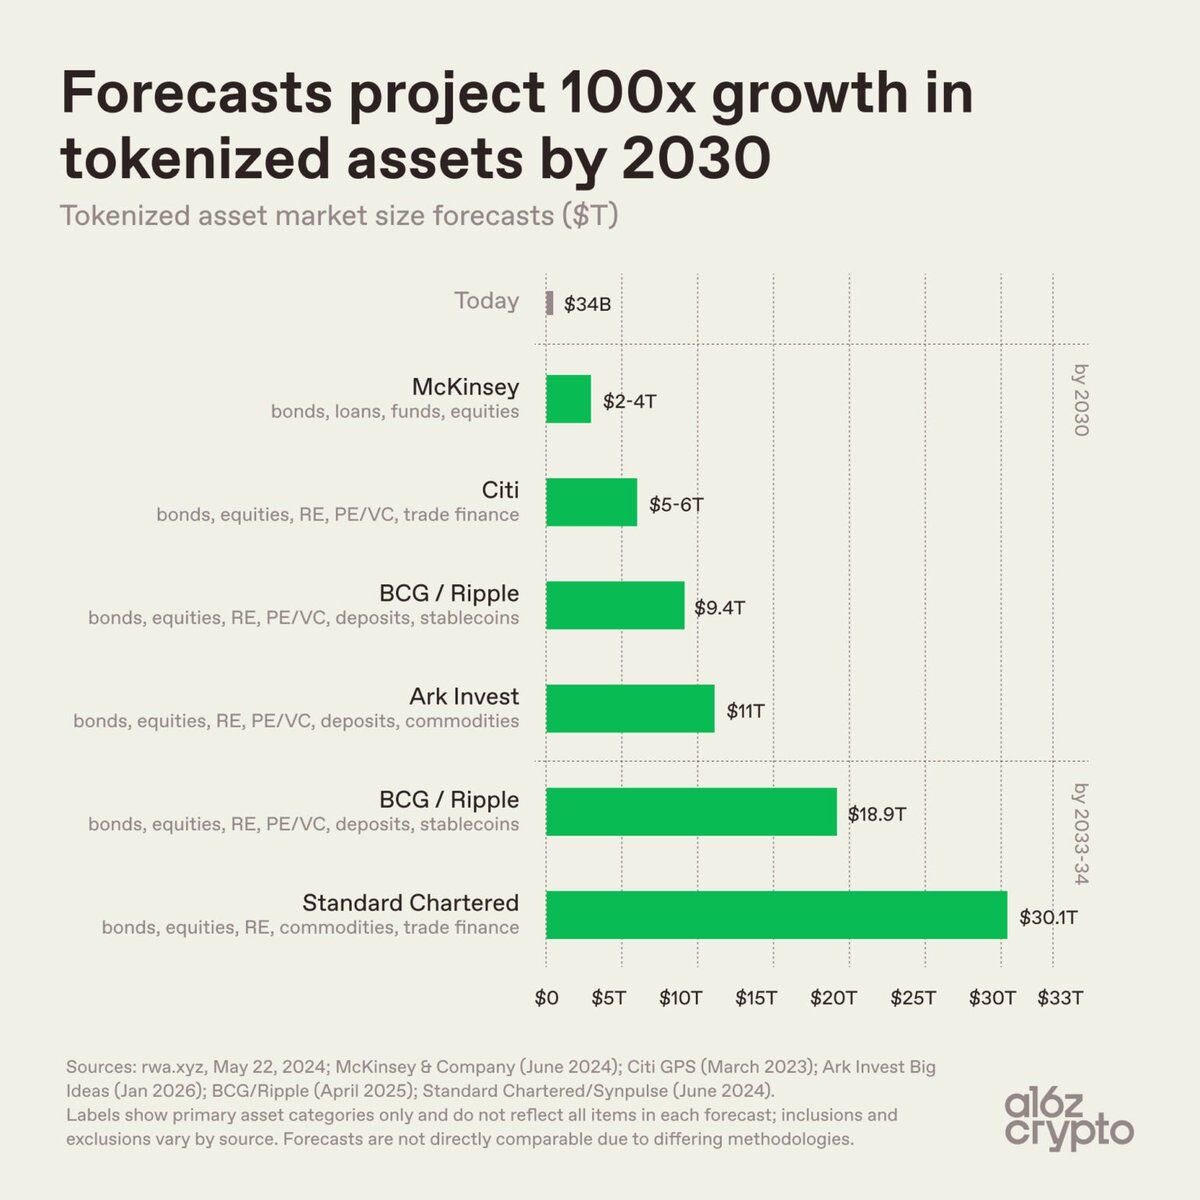
HUGE CALL FROM A16Z.
I agree and we aren’t taking this picture into consideration.
We’re too emotional about LTF PA and recency bias distorts our vision.
This is coming.
Ripple \ BCG collab to $9.4 Trillion by 2030?
$18.9 Trillion by 2034.
Now let’s make some assumptions and use some napkin maths.
IF all of this Ripple/ BCG TVL came onto the XRPL, AND that had a direct correlation with market cap, that would be roughly 110x by 2030 and 200x by 2034.
Even if there’s only a 50% correlation with market cap and TVL it’s a 50x+ in 4 years.
This is A16Z calling this, not just a moon boy on twitter.
This is what I’m trying to say to you all rn. This is it, this is the time.
Max Favorable +2.7%Max Adverse −24.1%ACTIVE
CR
𝕏
$XRP Huge Weekly Indicator Flashing. $12 Incoming! https://t.co/wUdSOfCJ1C via @YouTube
Max Favorable +10.1%Max Adverse −28.3%ACTIVE
Scored Calls · Full Audit Trail
CR
𝕏
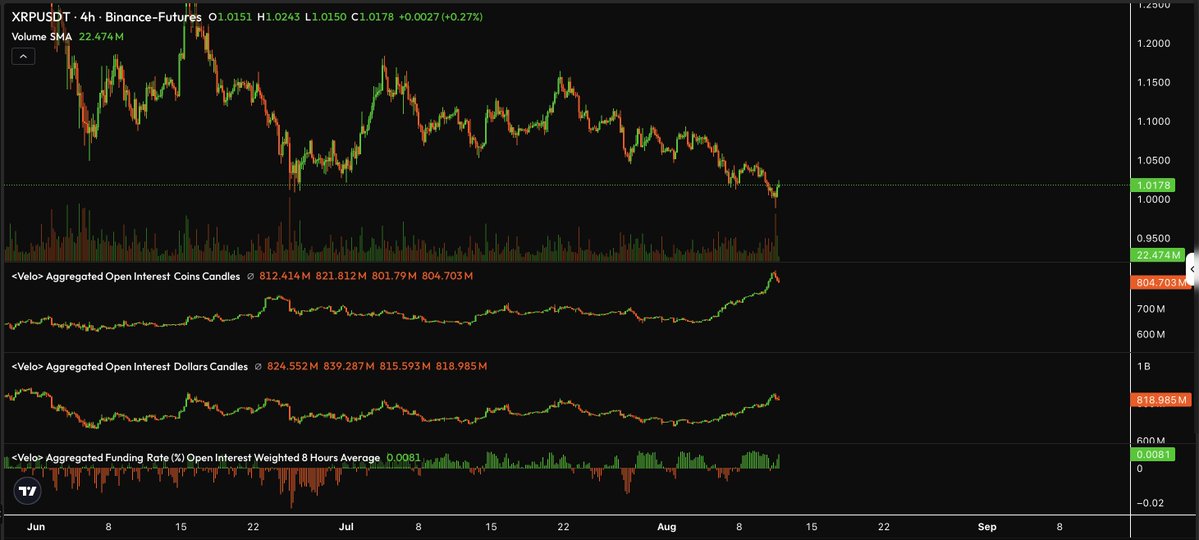
Still think there's a bigger move coming for ripple:native https://t.co/QvPTwWDAIj
Max Favorable +0.9%Max Adverse −0.1%Opportunity 0.66Time 1.00Magnitude 0.66Score 0.67
CR
𝕏
ripple:native briefly dipped below a dollar.
Since then, we have seen it relatively out perform most other tokens.
With that being said, I still don’t see much volume, like at all (especially not to the rate I thought we would).
And, I see some OI get wiped, but I have to say I feel there’s further down to come based on the above alone.
Max Favorable +0.3%Max Adverse −1.0%Opportunity 0.27Time 0.00Magnitude 0.27Score 0.13
CR
𝕏
In April 2025, when ripple:native was hovering and finding support multiple times around the $1.90 level, we had red liquidity building below us, similarly to how we do now.
When we finally lost that $1.90 support, XRP crashed 15.2% in a single day before ultimately recovering and then going on to set a new all time high in July 2025.
Now, if we did something similar in terms of move size, we would come down to around $0.85.
After the July all time highs, we did come down and sweep the liquidity that was left below. This happened on October 10th.
This is one of the things that I've been so vocal about in this cycle currently. I want this liquidity gone below us because, as you can see when I show you from this zoomed out perspective, that's the last bit of liquidity to the downside that we really have on XRP.
If, slash, when we take this, the only real thing left will be all time highs.
So, I'll be saying that I think we're going to start to head back at least towards the liquidity up at $1.87, and then from there, it looks like we stair step different areas in order to chase liquidity up towards all time highs.


Max Favorable +0.2%Max Adverse −0.2%Opportunity 0.15Time 1.00Magnitude 0.15Score 0.41
CR
𝕏
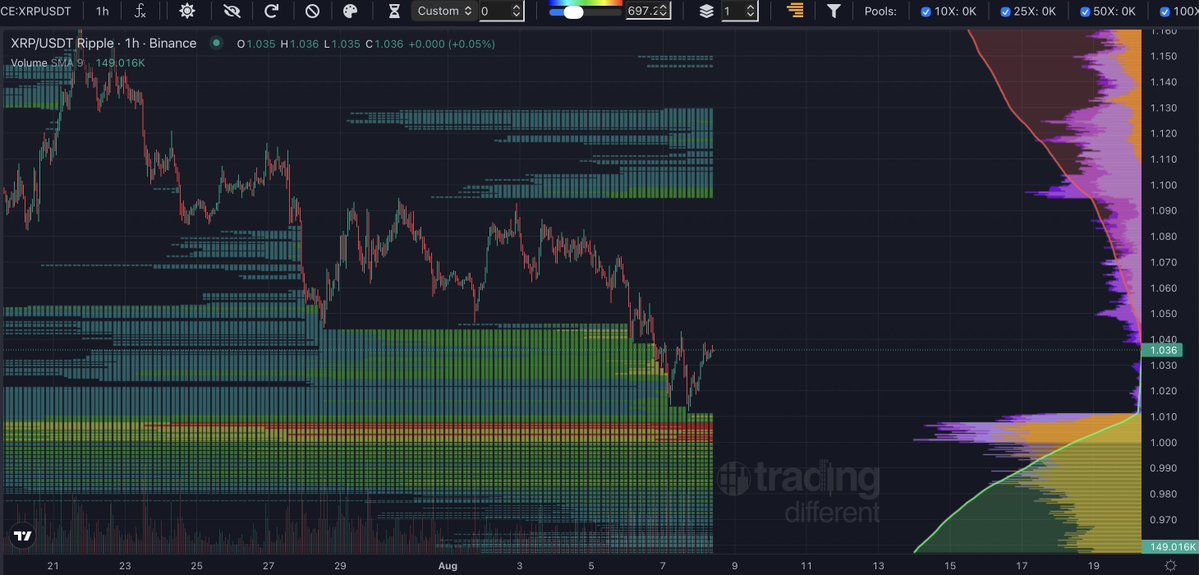
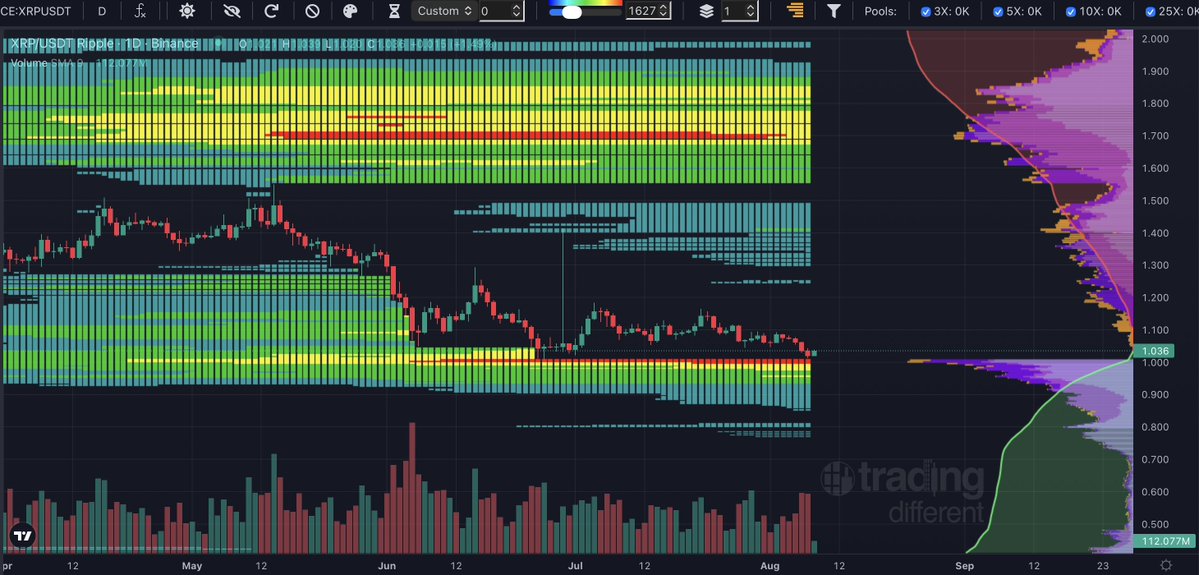
ripple:native liquidity on the hourly building below us at $1.
With dense liquidity below that on the daily and also looking like liquidity above us being removed?
Lows could be close, maybe another 10-15% downside for the bottom here.
What are liquidity pools?
Leverage liquidity pools are one of the biggest reasons crypto moves so violently.
Every leveraged position has a liquidation price. When thousands of traders have their liquidations clustered around the same level, it creates a liquidity pool.
👇 Long liquidations below price = forced selling.
👆 Short liquidations above price = forced buying.
Once price reaches these areas, liquidations can cascade, creating sharp moves that often look like the market is "hunting stops."
This is why you'll often see:
• A fast wick below support before reversing.
• A violent breakout through resistance.
• Bigger moves than spot buying and selling alone would normally create.
These liquidity pools don't dictate the long-term trend, but they often dictate the path price takes to get there.
Understanding where leverage is concentrated can help explain why crypto regularly makes those seemingly irrational moves.
Max Favorable +0.0%Max Adverse −1.3%Opportunity 0.03Time 0.00Magnitude 0.03Score 0.01
CR
𝕏
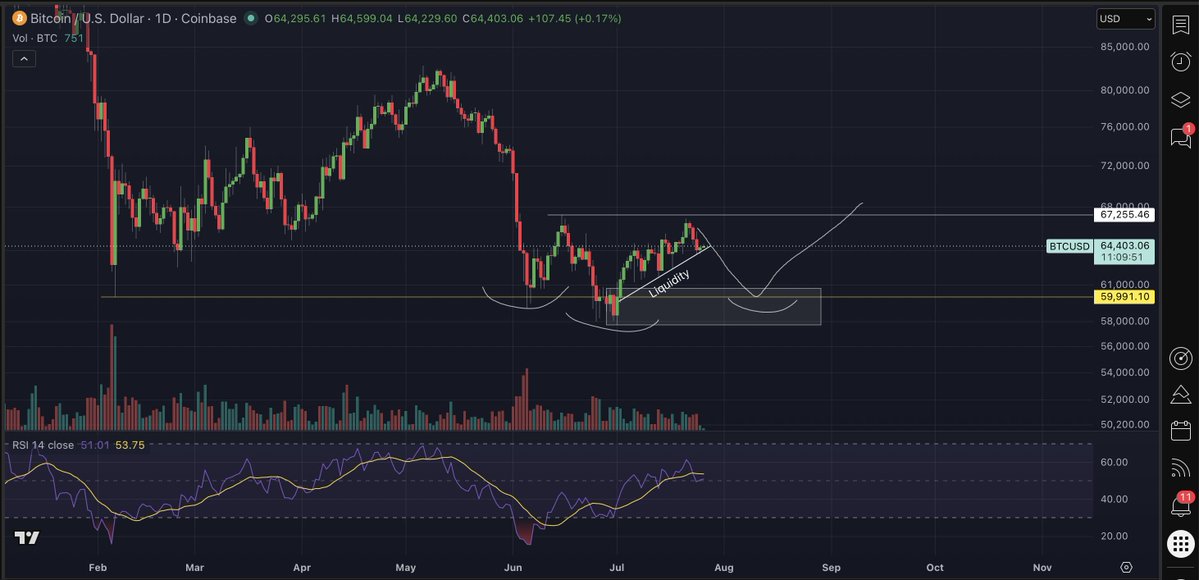
I still think something like this is the most likely path for bitcoin:native.
With that being said, if Bitcoin continues to hold above the "liquidity" line, it is technically in an uptrend as it continues to make higher lows and higher highs.
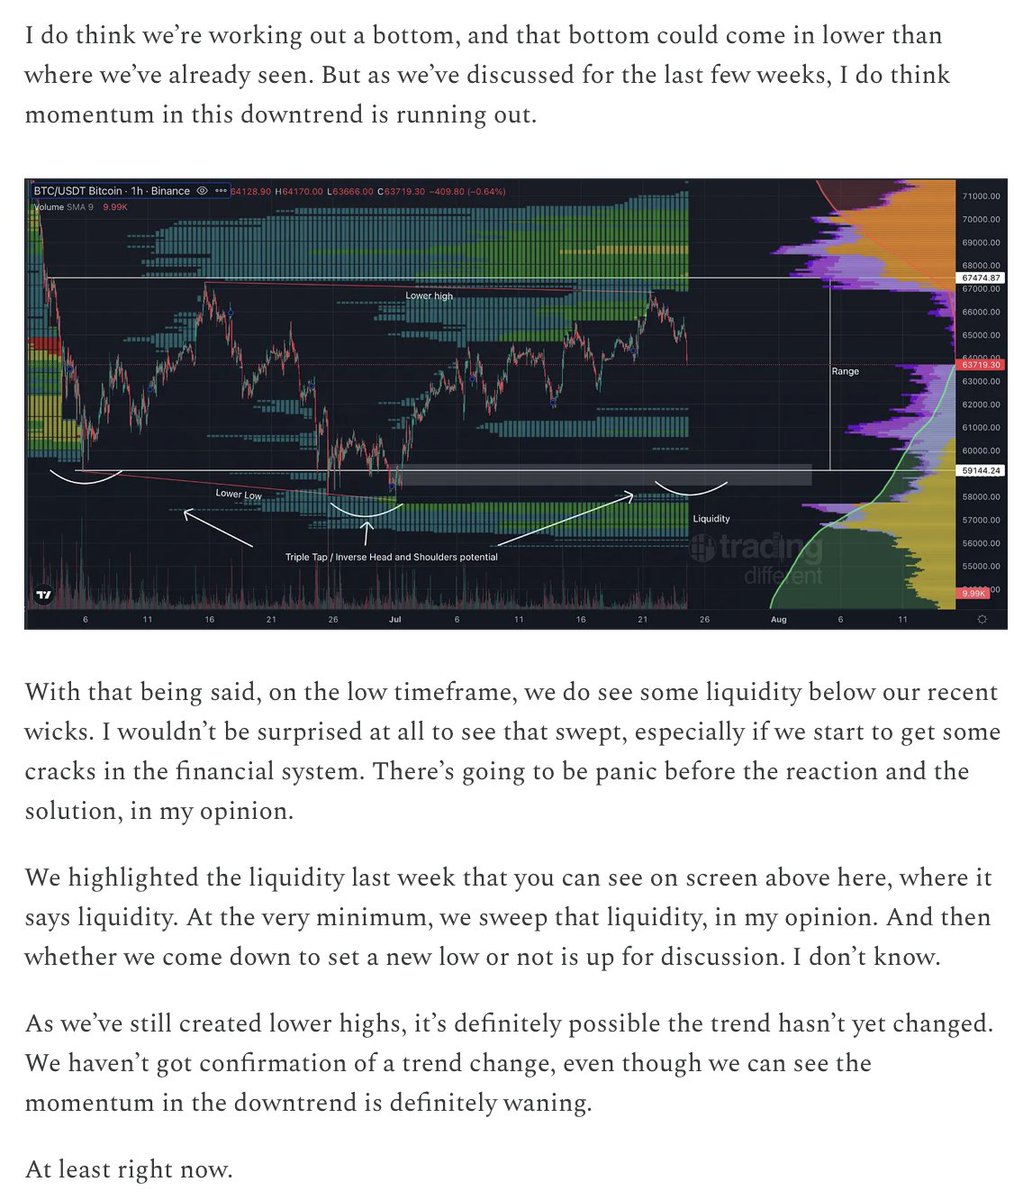
We have a daily bearish cross on the RSI. I am looking for a backtest of the order block between $57,700 and $60,700. This would sweep liquidity, get us a triple tap on the February 6th capitulation wick and potentially an inverse head and shoulders bottom.
There is potential for a low sweep too, I broke down this LTF PA in my newsletter yesterday.
I think this is a good time to continue to DCA overall, I just think bottoms take a while to form and are meant to wrong foot everyone. I see a lot of the TL flip to the bottom is in at the same time and I know from previous cycles we need to see that hope fade and people start to say it'll never come back before it does.
Max Favorable +0.1%Max Adverse −0.7%Opportunity 0.07Time 0.00Magnitude 0.07Score 0.04