@CredibleCrypto
“@CredibleCrypto sits at 50.2% accuracy across 90 calls, focusing heavily on BTC and ETH with a strong bullish lean (90% long calls) and better results on short-term horizons (58.8%) than longer ones. Their edge shows most clearly in Wick/Liquidity grab setups, where they specialize in identifying short-term price manipulation patterns across majors and DeFi tokens like CRV and CVX.”
Score Breakdown
| CallRank Score | Move · Path · Time | Scored | |
|---|---|---|---|
| ALL-TIME | 51% | 0.63 · 0.48 · 0.46 | 95 |
| YTD | 51% | 0.66 · 0.46 · 0.46 | 40 |
| 30D | — | — | 0 |
CallRank Score by Duration
Short term61% 33 calls
Medium term50% 40 calls
Long term41% 22 calls
CallRank Score · Last 12 Months
Asset Breakdown — Top 5
| Asset | CallRank Score | Calls | 🟢 Bull · 🔴 Bear |
|---|---|---|---|
| CRV | 57% | 29 | 29 · 0 |
| BTC | 44% | 27 | 24 · 3 |
| ETH | 43% | 15 | 13 · 2 |
| XRP | 52% | 10 | 9 · 1 |
| CVX | 77% | 6 | 5 · 1 |
Live Calls Summary · By Horizon
@CredibleCrypto's active forecasts grouped by horizon and asset. L = Long, S = Short, number = open call count.
Active assets for this forecaster:
| No assets selected | |
|---|---|
| ST | — |
| MT | — |
| LT | — |
ST = Short term · MT = Medium term · LT = Long term
Active Calls · 4 Live
CR
𝕏
$BTC, $ETH and $XRP 🔴 on the daily.
$CRV and $CVX 🟢 on the daily.
Both starting to outperform and expecting this to continue for at minimum 70+% to the upside and ideally targeting 200+% to the upside.
All covered in the vid in my pinned tweet.
If you haven’t watched it yet this is your sign that you should.
Max Favorable +4.2%Max Adverse −0.6%ACTIVE
CR
𝕏
$BTC, $ETH and $XRP 🔴 on the daily.
$CRV and $CVX 🟢 on the daily.
Both starting to outperform and expecting this to continue for at minimum 70+% to the upside and ideally targeting 200+% to the upside.
All covered in the vid in my pinned tweet.
If you haven’t watched it yet this is your sign that you should.
Max Favorable +5.1%Max Adverse −1.8%ACTIVE
CR
𝕏
On higher timeframes, I am unequivocally bullish on $ETH, and I made a very in-depth video last week explaining why (pinned tweet).
Based on developing PA, we have a few different ways this can play out on lower timeframes though.
This post will cover the potential options and explain what you should be looking for:
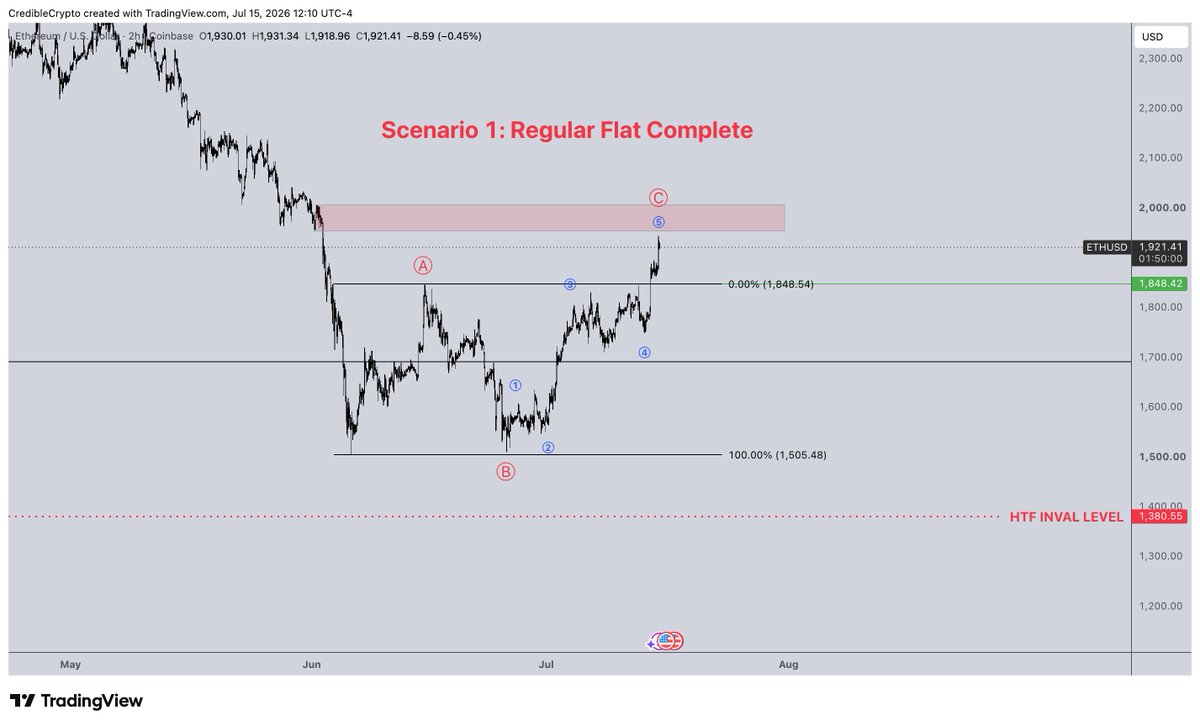
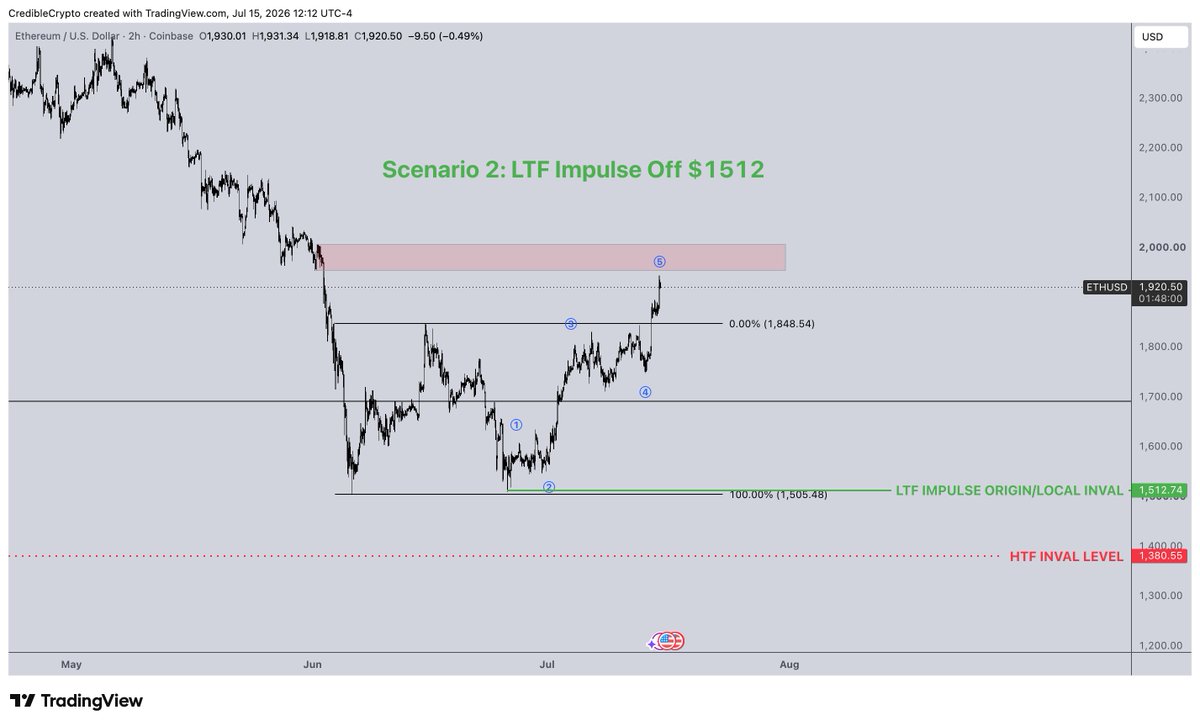
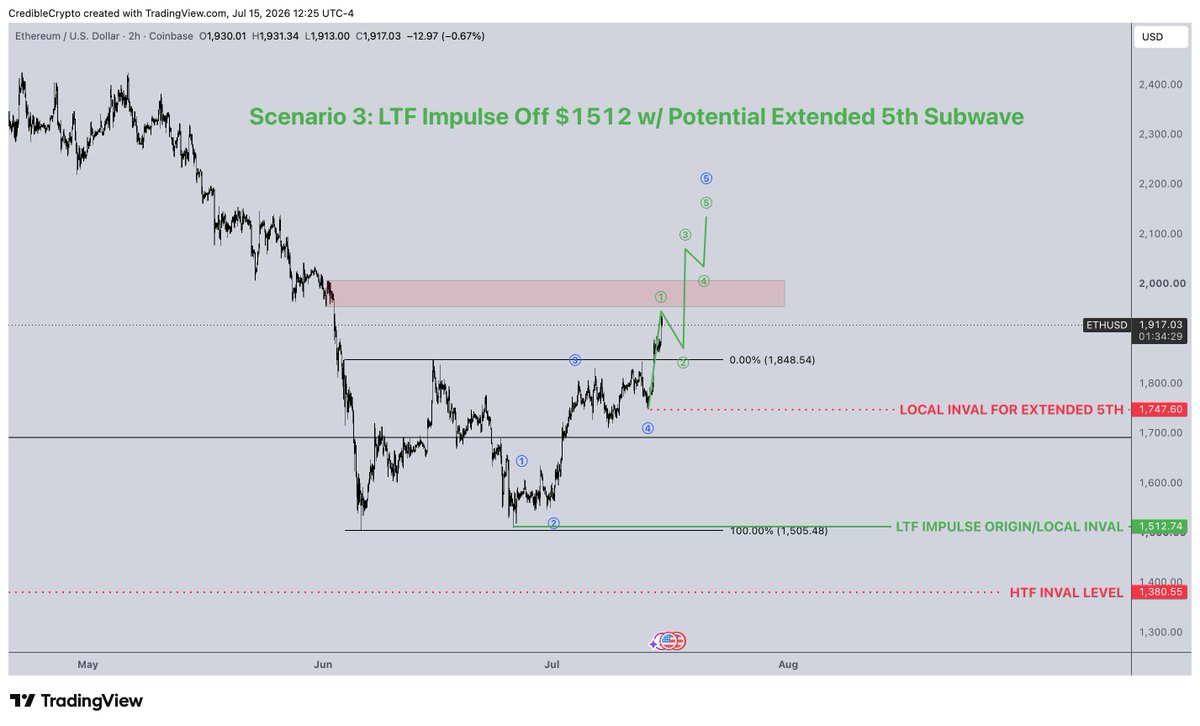
There are 3 main possibilities on the table right now.
Two of the three suggest that our bottom on $ETH is already in.
1 of the three allows for a marginal lower low below $1500 but not below $1380.
Let's break each one down:
Scenario 1: This is technically the "least bullish" option. We have what looks like a potential 5 wave impulse off of our lows, but this is preceded by two corrective structures, giving us a classic "flat" corrective structure (3-3-5) that means this LTF impulsive move up was just the "C" wave of a corrective structure to local supply (in non EW terms, essentially just ranging PA with a deviation above the highs). In this scenario, we would expect a pullback from here to at least sub $1700 and potentially below $1500 (new local lows) but not below $1380 (our HTF inval level).
Scenario 2: In this case, our bottom is already in on $ETH (yes, leaving behind a double bottom/equal lows). In this case we printed our 1st low timeframe impulse which would be kicking off the move that takes us to new all time highs and we would expect a pullback soon for our "wave 2" before continuation to the upside. In this case, a pullback below $1700 is likely, but we should NOT make new lows below $1500. This is neither the most bullish nor the least bullish option.
Scenario 3: In this scenario, we are printing our first low timeframe impulse (just like in Scenario 2) but it is not yet complete- and the 5th subwave may extend into the 2000's before any significant pullback. This would be the "most bullish" option that gives almost nothing in terms of a pullback (would not expect a move below even $1750).
Ultimately, on the LTF, all three options are currently on the table. We can't see the future so we will use developing PA, market context, and the process of elimination to narrow down the possibilities until only the most probable remains.
Meanwhile, on the HTF, our stance is clear- and there is only one primary expectation at this time- that our HTF bottom is being formed and we won't see below $1380's.
In a situation like this the plan is simple and straightforward if you agree with the above- load up on spot ETH for a HTF end-of-cycle hold while at the same time watching PA develop so we can narrow down a more precise trade entry on lower timeframes. If the lower TF entry is missed, we simply wait for the next one and in the meantime ride our spot holdings to new all time highs and ultimately, $20,000+ $ETH.
Max Favorable +1.3%Max Adverse −5.7%ACTIVE
CR
𝕏
Ethereum to $20,000+.
If you're holding ANY alt-coins, this video is probably the single most important piece of content you can watch right now,
The focus is on $ETH, but understanding the implications of what is being said here is important because it will affect the ENTIRE alt-coin market as a whole.
There is a lot here, but stick through it till the end and I know you will not be disappointed, trust me.
Likes/shares appreciated, enjoy! 👇
https://t.co/EPRuD2Cibf

Max Favorable +2.3%Max Adverse −2.0%ACTIVE
Scored Calls · Full Audit Trail
CR
𝕏
If you’re new to $CRV and $CVX and want to better understand the thesis behind them both, I recommend reading the three articles I wrote under my “articles” tab that focus on $CVX.
I talk primarily about CVX in those but because $CRV and $CVX are so closely aligned you should be able to understand the argument for both.
Both still trade at incredible value imo but based on the current trajectory the heavy discounts probably wont last too much longer.
Max Favorable +4.4%Max Adverse −0.1%Opportunity 0.86Time 1.00Magnitude 0.86Score 0.76
CR
𝕏
If you’re new to $CRV and $CVX and want to better understand the thesis behind them both, I recommend reading the three articles I wrote under my “articles” tab that focus on $CVX.
I talk primarily about CVX in those but because $CRV and $CVX are so closely aligned you should be able to understand the argument for both.
Both still trade at incredible value imo but based on the current trajectory the heavy discounts probably wont last too much longer.
Max Favorable +4.6%Max Adverse −3.2%Opportunity 0.93Time 1.00Magnitude 0.93Score 0.68
CR
𝕏
Curve it to mid .30’s posthaste 🫡 $CRV
Max Favorable +7.3%Max Adverse −1.1%Opportunity 0.99Time 1.00Magnitude 0.99Score 0.83
CR
𝕏
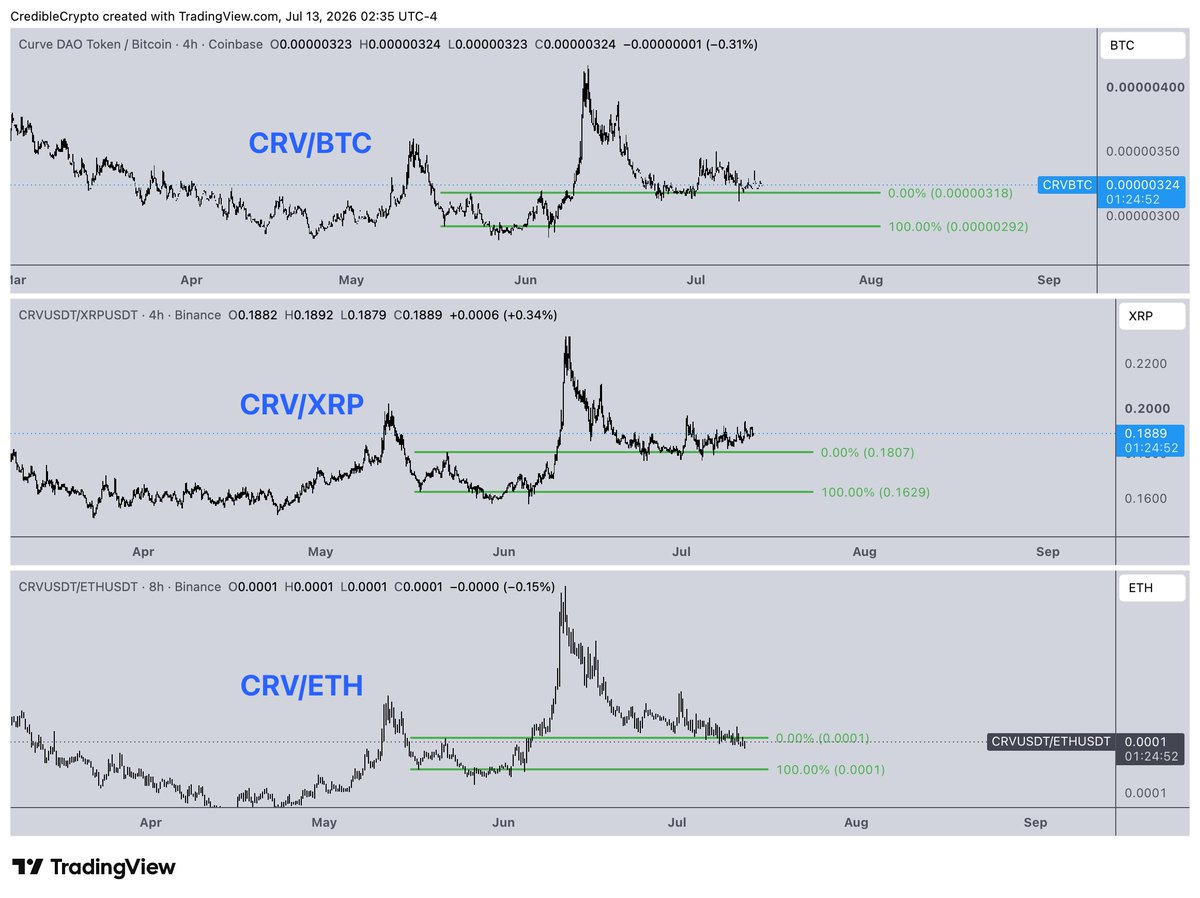
Good things tend to happen when we get this sort of confluence...
$CRV had a LTF bullish MS break against $BTC, $ETH and $XRP and has now pulled back to the LTF consolidation range that preceded the breakout.
This is where we would like to see a higher low formed for continuation to the upside (and new local highs).
Let's see if it's finally time to curve it...
Max Favorable +12.8%Max Adverse −0.3%Opportunity 0.95Time 1.00Magnitude 0.95Score 0.94
CR
𝕏
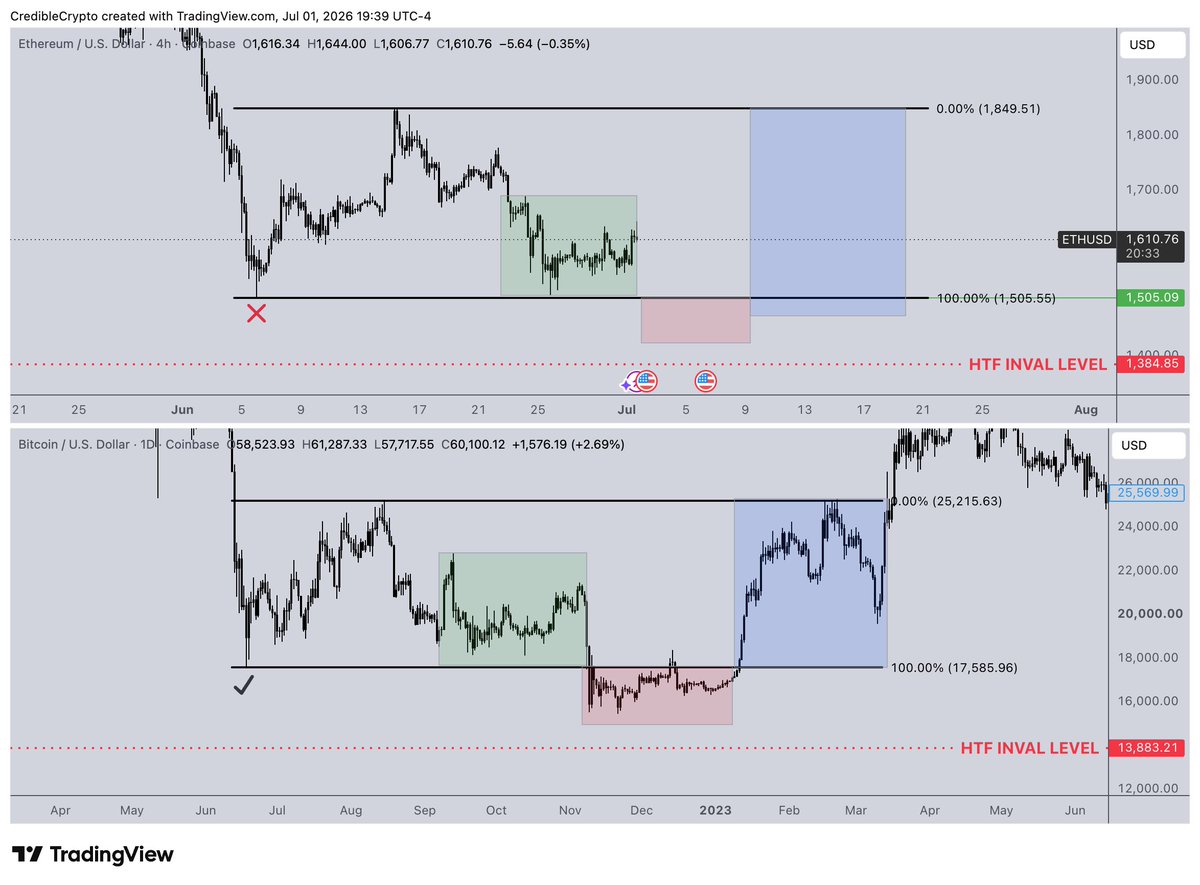
I have a feeling our macro $ETH bottom at $1,500 is going to look very similar to our macro $BTC bottom at $15,000... https://t.co/lfWIhYpClB
Max Favorable +13.6%Max Adverse −1.0%Opportunity 0.86Time 0.98Magnitude 0.86Score 0.91