@Tatrader_alan
“@Tatrader_alan has a 48.1% all-time accuracy across 1,362 calls, focusing on short- and mid-term setups across DOGE, BTC, ETH, and SOL with an almost exclusively bullish bias (95% long calls). Break/Pump setups are their most-used call type, though a declining YTD accuracy of 39.4% suggests the strongly directional long-only approach has struggled in recent market conditions.”
Score Breakdown
| CallRank Score | Move · Path · Time | Scored | |
|---|---|---|---|
| ALL-TIME | 48% | 0.61 · 0.43 · 0.40 | 1412 |
| YTD | 40% | 0.58 · 0.36 · 0.31 | 470 |
| 30D | — | — | 0 |
CallRank Score by Duration
Short term51% 335 calls
Medium term49% 512 calls
Long term46% 565 calls
CallRank Score · Last 12 Months
Asset Breakdown — Top 5
| Asset | CallRank Score | Calls | 🟢 Bull · 🔴 Bear |
|---|---|---|---|
| DOGE | 48% | 851 | 809 · 42 |
| BTC | 48% | 335 | 321 · 14 |
| ETH | 48% | 147 | 135 · 12 |
| SOL | 44% | 47 | 47 · 0 |
| MNT | 48% | 27 | 27 · 0 |
Live Calls Summary · By Horizon
@Tatrader_alan's active forecasts grouped by horizon and asset. L = Long, S = Short, number = open call count.
Active assets for this forecaster:
| No assets selected | |
|---|---|
| ST | — |
| MT | — |
| LT | — |
ST = Short term · MT = Medium term · LT = Long term
Active Calls · 50 Live
TA
𝕏
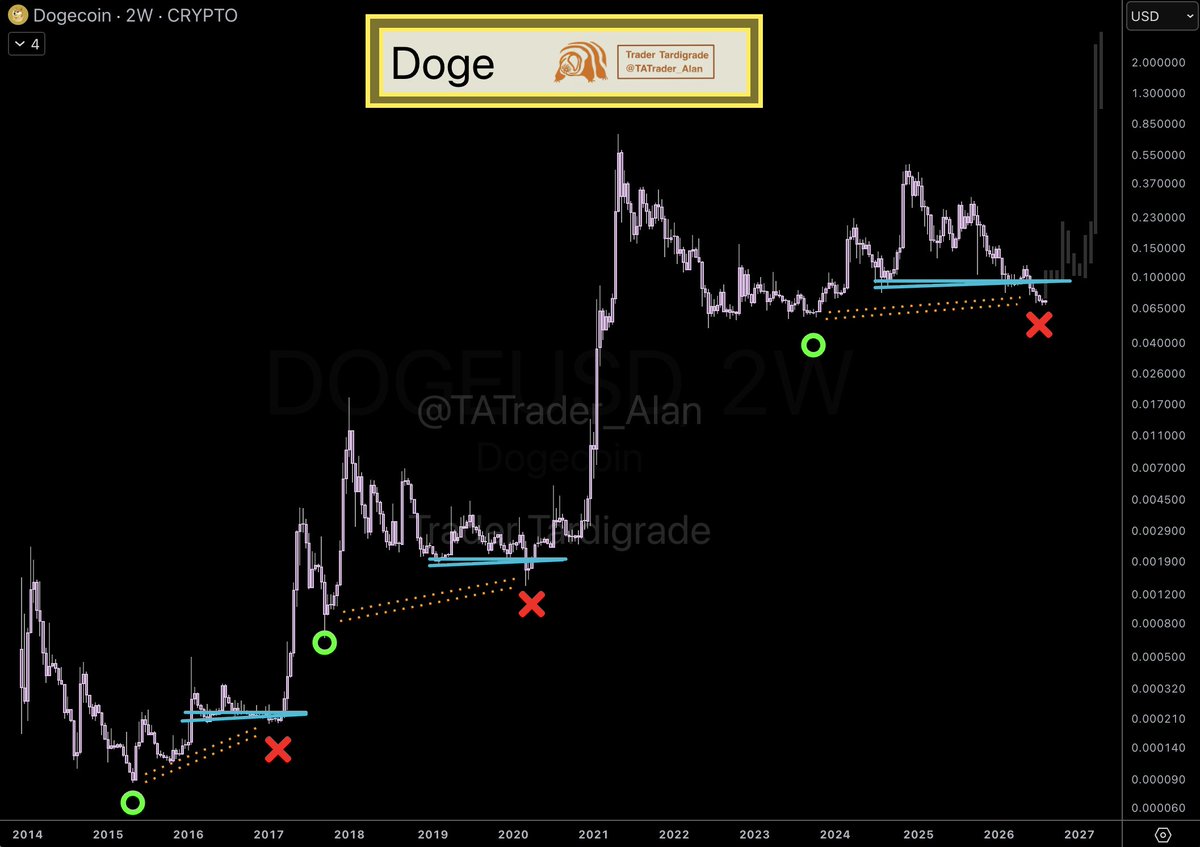
$Doge/2-week
#Dogecoin all-time chart shows the same rule every cycle.
🟢 Bottom forms
🔵 Price consolidates at support
❌ Breakdown happens
🚀 Massive rally follows
2017: Breakdown → Explosive move ✅
2020: Breakdown → Explosive move ✅
2026: Breakdown → ?
✍️ The breakdown just happened. The pattern is scheduled.
We are at the best spot right now 🚀
Max Favorable +1.0%Max Adverse −1.8%ACTIVE
TA
𝕏
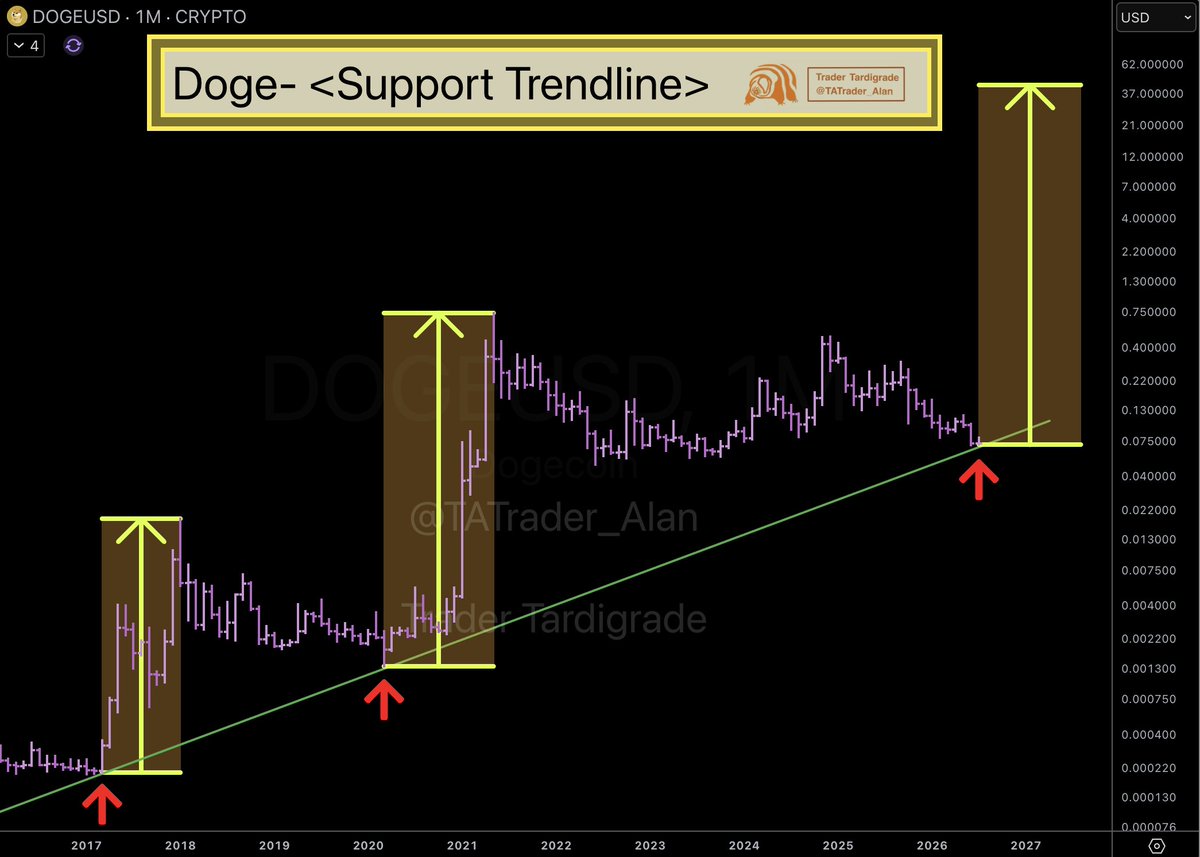
$Doge/monthly
#Dogecoin bounces every single time it touches this support trendline — and the pump after each touch is accelerating.
2017: Touch → Pump
2020: Touch → Bigger pump
2026: Touch → ?
This is a long-term support that has held for nearly a decade. Every bounce gets more explosive.
✍️ We just touched the line again right now.
The pattern repeats. The next pump is loading 🚀
Max Favorable +1.6%Max Adverse −0.4%ACTIVE
TA
𝕏
$Doge/monthly
#Dogecoin Stoch RSI is flashing the same signal that triggered every major rally.
2022: Stoch RSI bottomed → Massive surge ✅
2026: Stoch RSI bottomed → ?
The monthly Stoch RSI has hit oversold and will turn up, $DOGE explodes to a new high soon.
The indicator doesn't lie. The setup is identical.
Another high is loading 🚀

Max Favorable +0.1%Max Adverse −0.9%ACTIVE
TA
𝕏
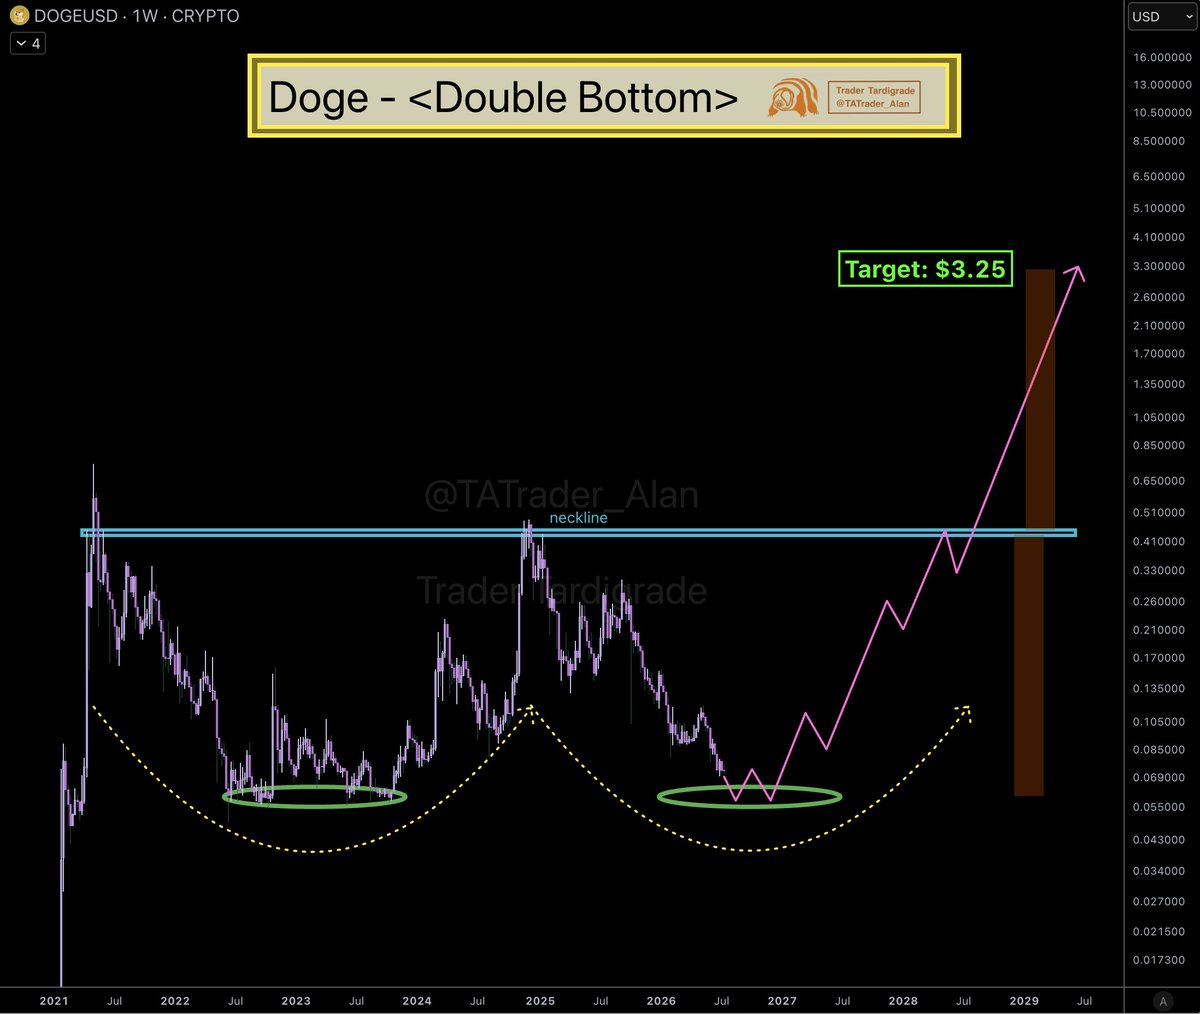
$Doge/weekly
#Dogecoin has formed a massive Double Bottom — and the measured move is screaming.
📉 First bottom ✅
📉 Second bottom 🔄
🎯 Target: $3.25 🔄
The structure is perfect. This is one of the most reliable reversal patterns in technical analysis.
$3.25 incoming 🚀 https://t.co/AqzRHfGvSm
Max Favorable +1.7%Max Adverse −1.7%ACTIVE
TA
𝕏
$Doge/weekly
✍️ I can't be more bullish than this Bullish Pennant ever.
#Dogecoin has formed the cleanest compression I've seen — tight consolidation, decreasing volume, textbook structure.
Every time $DOGE coils this tight inside a Bullish Pennant, it explodes.
The pattern is perfect. The setup is ready. The breakout is coming.
This is as bullish as it gets 🚀

Max Favorable +0.1%Max Adverse −5.2%ACTIVE
Scored Calls · Full Audit Trail
TA
𝕏
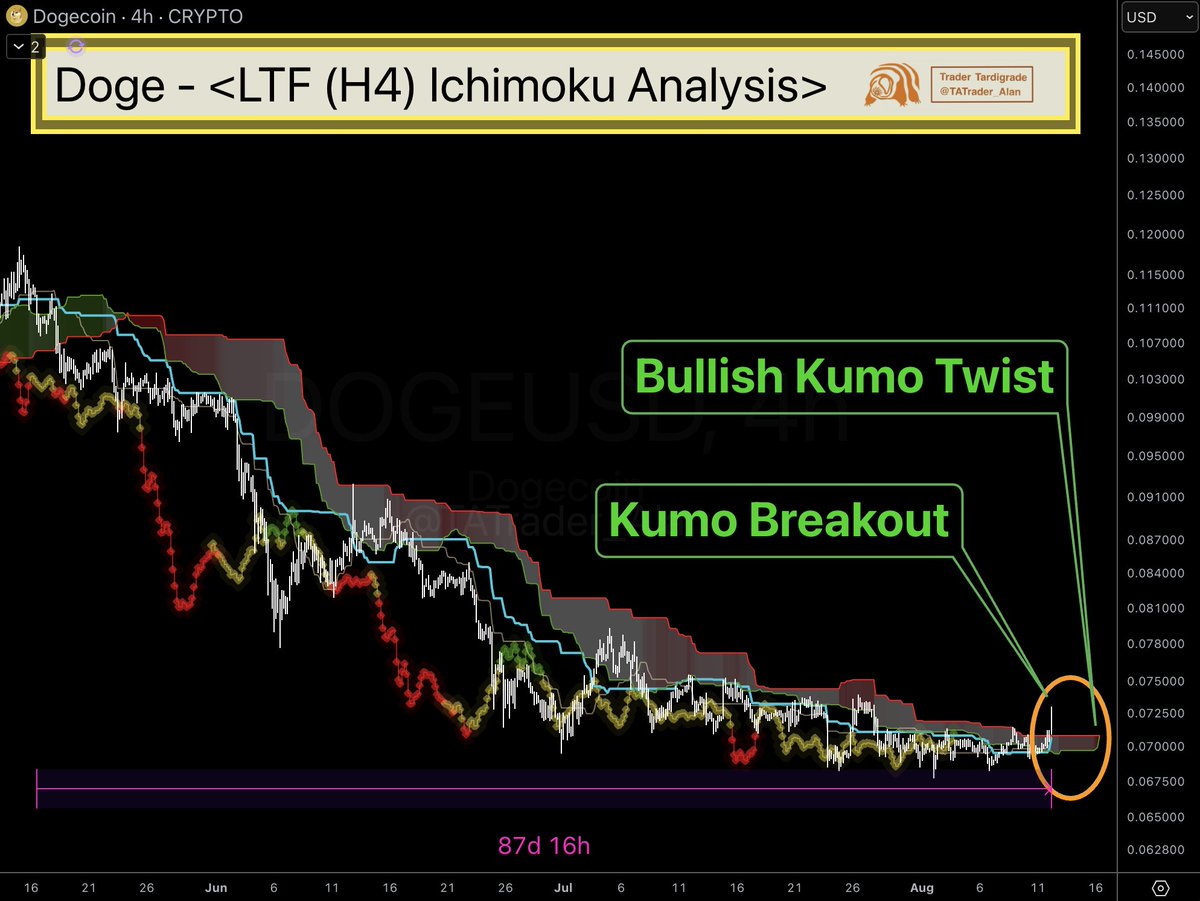
$Doge/4-hour
#Dogecoin Ichimoku is flashing two bullish signals right now.
1️⃣ Kumo Breakout: Price just cleared the cloud
2️⃣ Bullish Kumo Twist: About to confirm
$DOGE spent 87+ days trapped inside and below the Kumo cloud.
This is the first breakout moment in almost 3 months.
The cloud doesn't lie 🚀
Max Favorable +0.7%Max Adverse −0.3%Opportunity 0.53Time 0.67Magnitude 0.53Score 0.47
TA
𝕏
$Doge/daily
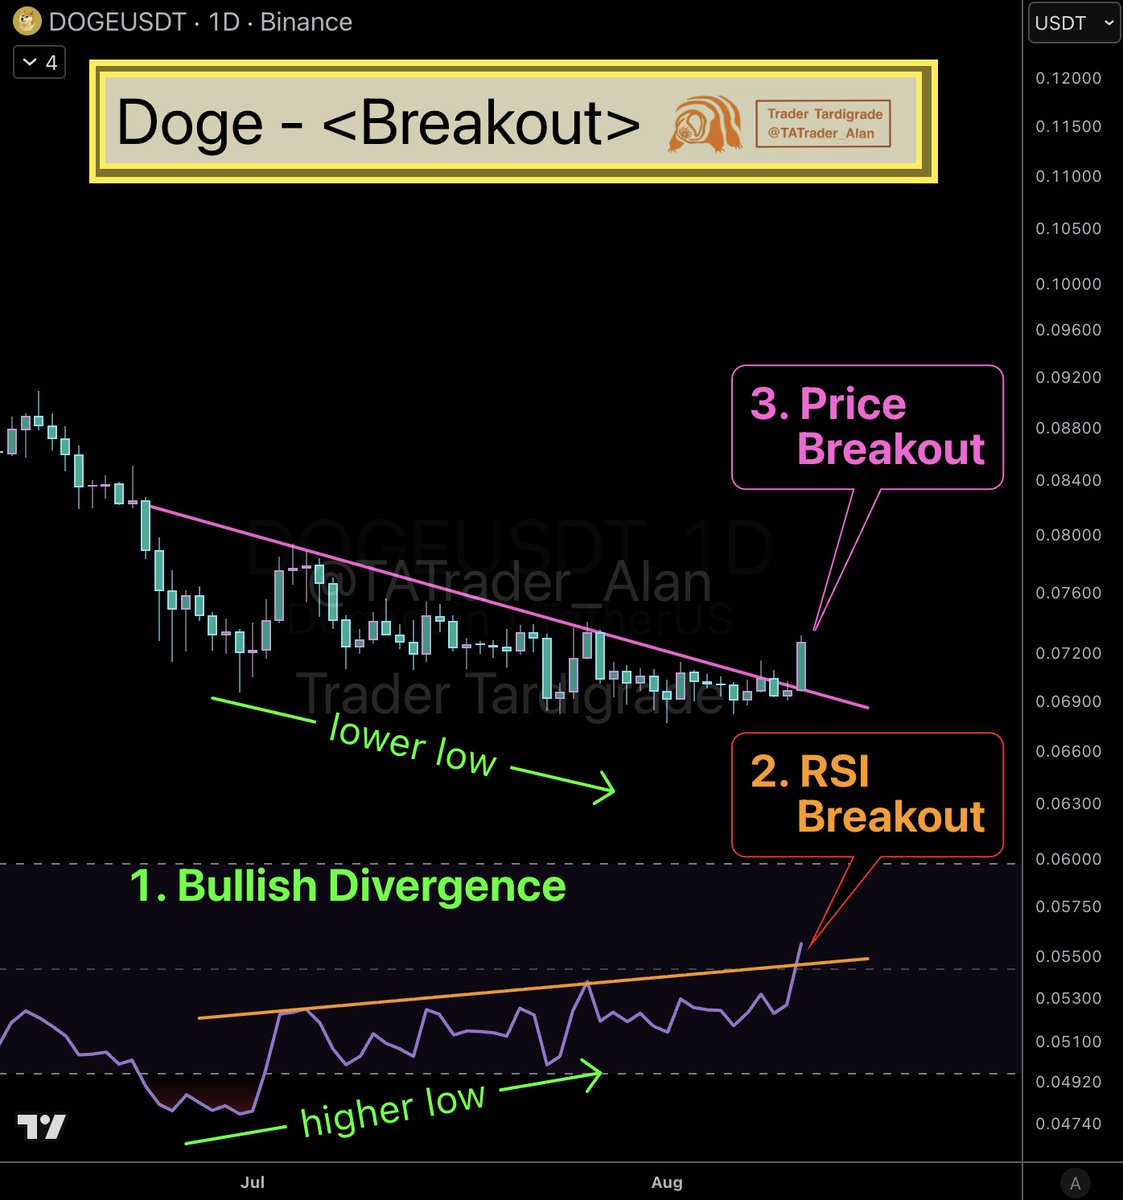
#Dogecoin daily chart is stacking three major bullish signals.
1️⃣ Bullish Divergence: Price printed lower lows while RSI formed higher lows for over a month (green) —> bottom formation
2️⃣ Price Breakout: Broke through descending trendline (purple) —> price action
3️⃣ RSI Breakout: Cleared ascending resistance trendline (orange) —> power confirmed
❇️ When RSI shows strength while price breaks resistance, the bottom is likely in.
🚀 Breakout confirmed 🚀
Max Favorable +0.4%Max Adverse −1.4%Opportunity 0.32Time 0.00Magnitude 0.32Score 0.14
TA
𝕏
$Doge/daily
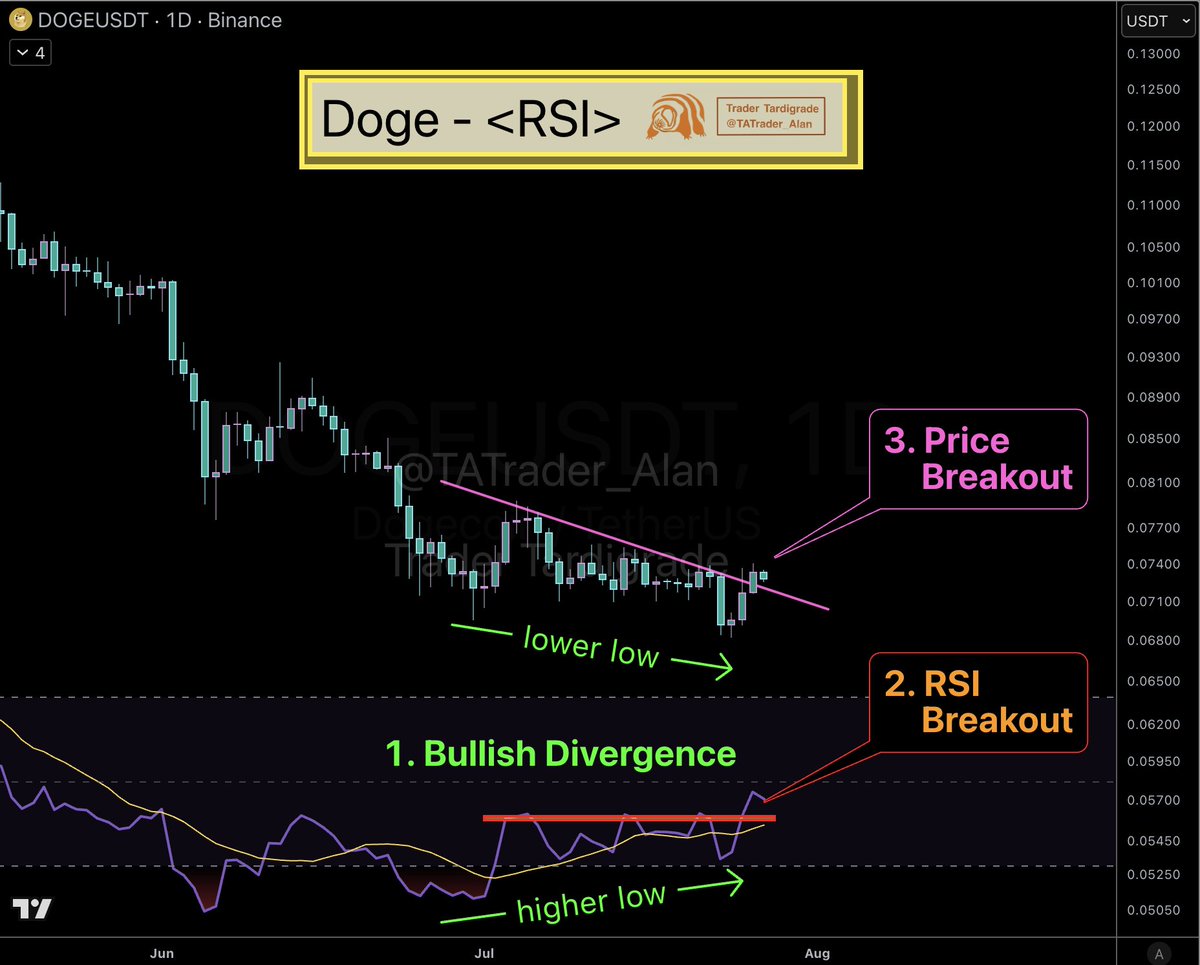
#Dogecoin is stacking bullish signals — three confirmations on the same chart.
1️⃣ Bullish Divergence: Price formed lower lows, RSI printed higher lows
2️⃣ RSI Breakout: Broke through horizontal resistance
3️⃣ Price Breakout: Cleared the descending trendline
When all three signals align like this, the reversal is real.
Breakout confirmed 🚀
Max Favorable +0.6%Max Adverse −2.7%Opportunity 0.40Time 0.00Magnitude 0.40Score 0.15
TA
𝕏
$Doge/daily
#Dogecoin is breaking out of a descending trendline — and the bottom pattern is mirroring the top perfectly.
🔴 Top pattern: Double peak structure
🟢 Bottom pattern: Double dip structure
The symmetry is textbook. Every peak at the top has a matching dip at the bottom.
✍️ Breakout confirmed. Trendline resistance broken.
Price is reversing right now 🚀

Max Favorable +1.9%Max Adverse −0.4%Opportunity 0.73Time 0.50Magnitude 0.73Score 0.53
TA
𝕏
$ETH/3-day
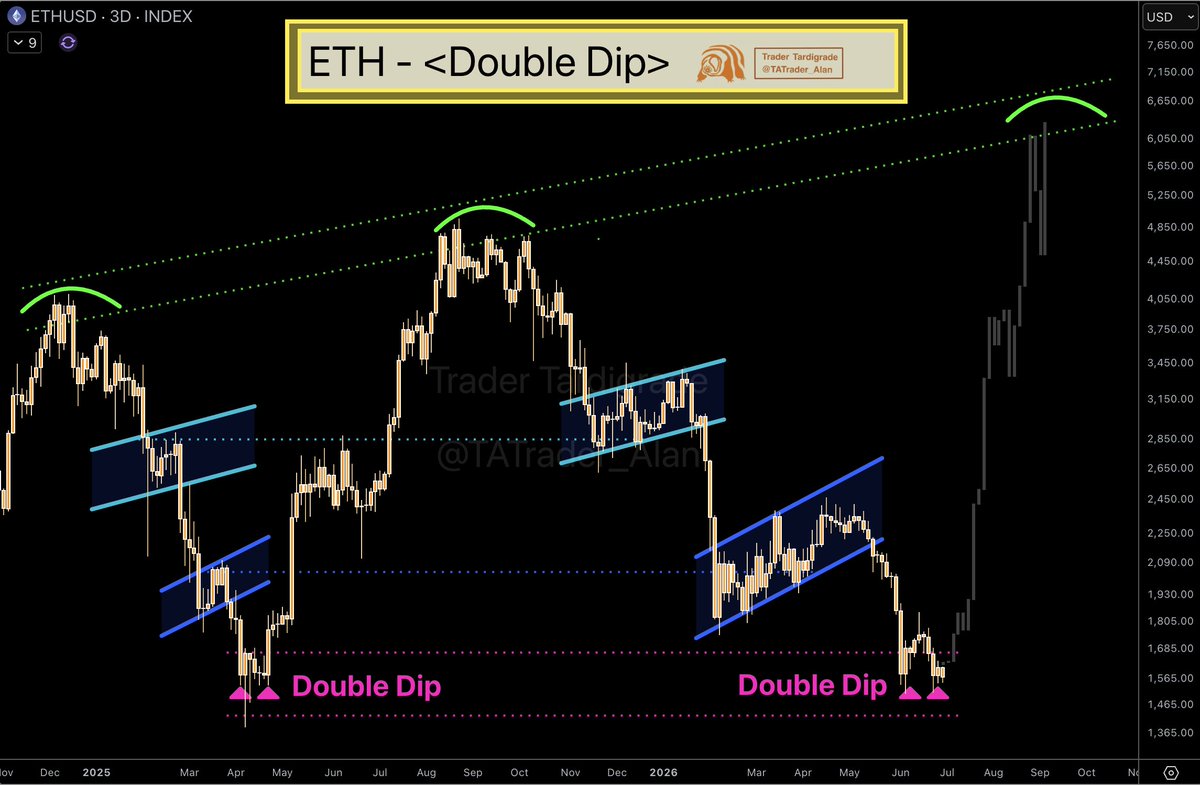
#Ethereum has formed the same Double Dip pattern twice — and it's happening just right now.
2025: Double Dip → Massive surge
2026 (now): Double Dip forming → ?
$ETH formed this Double Dip structure, and then the price exploded to the upside.
The pattern is identical. The setup is textbook. The dip is complete.
Next leg up is loading 🚀
Max Favorable +10.0%Max Adverse −0.8%Opportunity 0.89Time 1.00Magnitude 0.89Score 0.78