@Eliz883
“@Eliz883 posts a high volume of bullish calls across BTC, ETH, and mid-cap alts like TAO and FARTCOIN, with mid-term horizons being their strongest timeframe at 50.5% accuracy. Their most distinctive edge lies in Break/Pump and Wick/Liquidity grab setups, which together make up nearly half of all their calls.”
Score Breakdown
| CallRank Score | Move · Path · Time | Scored | |
|---|---|---|---|
| ALL-TIME | 49% | 0.62 · 0.42 · 0.40 | 576 |
| YTD | 44% | 0.58 · 0.39 · 0.37 | 234 |
| 30D | — | — | 0 |
CallRank Score by Duration
Short term48% 207 calls
Medium term50% 319 calls
Long term45% 50 calls
CallRank Score · Last 12 Months
Asset Breakdown — Top 5
| Asset | CallRank Score | Calls | 🟢 Bull · 🔴 Bear |
|---|---|---|---|
| BTC | 48% | 158 | 96 · 62 |
| ETH | 51% | 68 | 49 · 19 |
| TAO | 52% | 33 | 33 · 0 |
| FARTCOIN | 56% | 16 | 11 · 5 |
| CRV | 51% | 12 | 11 · 1 |
Live Calls Summary · By Horizon
@Eliz883's active forecasts grouped by horizon and asset. L = Long, S = Short, number = open call count.
Active assets for this forecaster:
| No assets selected | |
|---|---|
| ST | — |
| MT | — |
| LT | — |
ST = Short term · MT = Medium term · LT = Long term
Active Calls · 10 Live
EL
𝕏
Good morning everyone, and have a lovely Sunday. ☀️
The market is at a decisive stage. We’ve been trading within the same range for weeks, but increasingly interesting technical signals are starting to emerge on $ETH.
My strategy hasn’t changed: I’m continuing to accumulate spot positions on dips, without chasing price surges and without letting myself be swayed by market noise.
For me, this is a time when you need to have a plan and stick to it.
How will it end? We’ll find out over the coming months.
My view is simple: either it will be a total failure, heading to zero, or we’ll see Ethereum heading towards $6,000–$7,000. I don’t think there’ll be a real middle ground.
We’ll see whether my investment goes to zero or makes some good returns.
As for trading, I’ll go with what the market offers.
Max Favorable +2.3%Max Adverse −1.7%ACTIVE
EL
𝕏
GMMMMMM leggenda
22/23 vs 25/26 bitcoin:native
Same pattern, same story
Buying spot on dips from here is a relaxed approach to long-term investing https://t.co/am8wY4vTzL
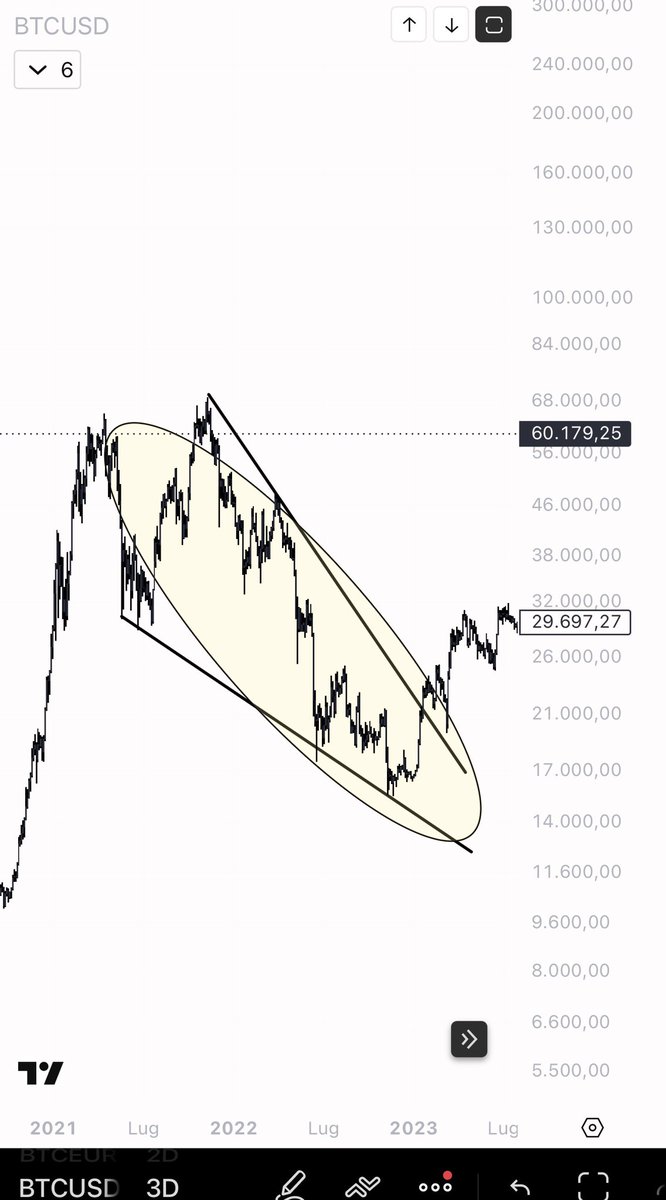
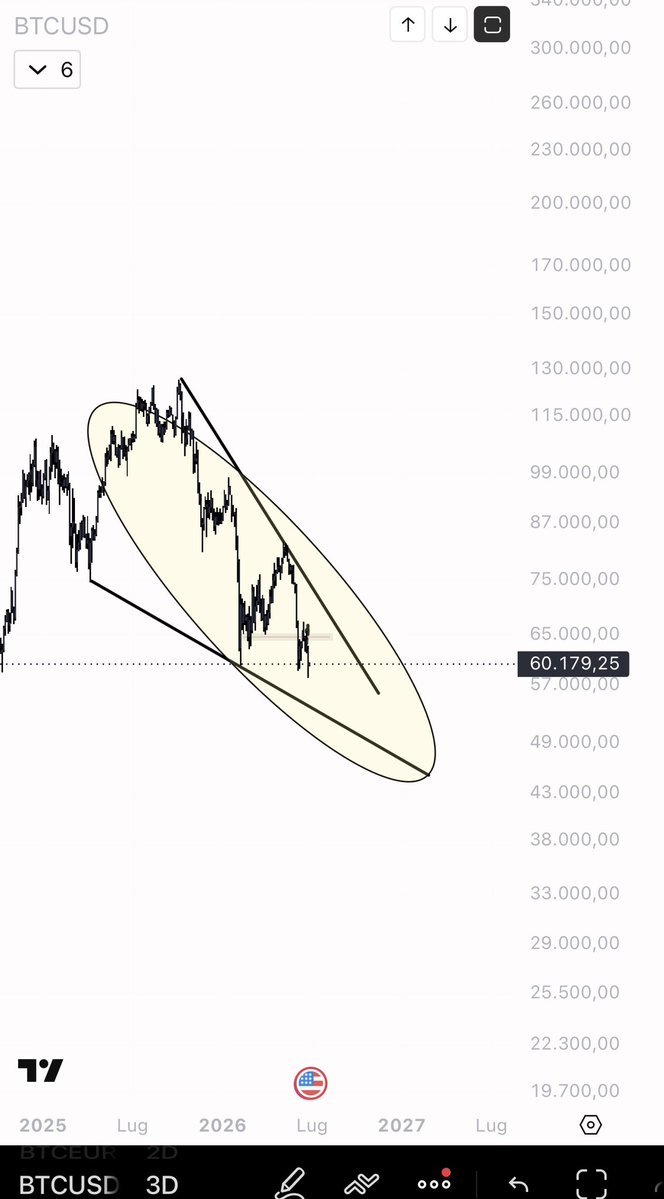
Max Favorable +5.2%Max Adverse −4.2%ACTIVE
EL
𝕏
GMMMMMM leggenda
22/23 vs 25/26 bitcoin:native
Same pattern, same story
Buying on dips from here is a relaxed approach to long-term investing https://t.co/3Wz61YfSLM
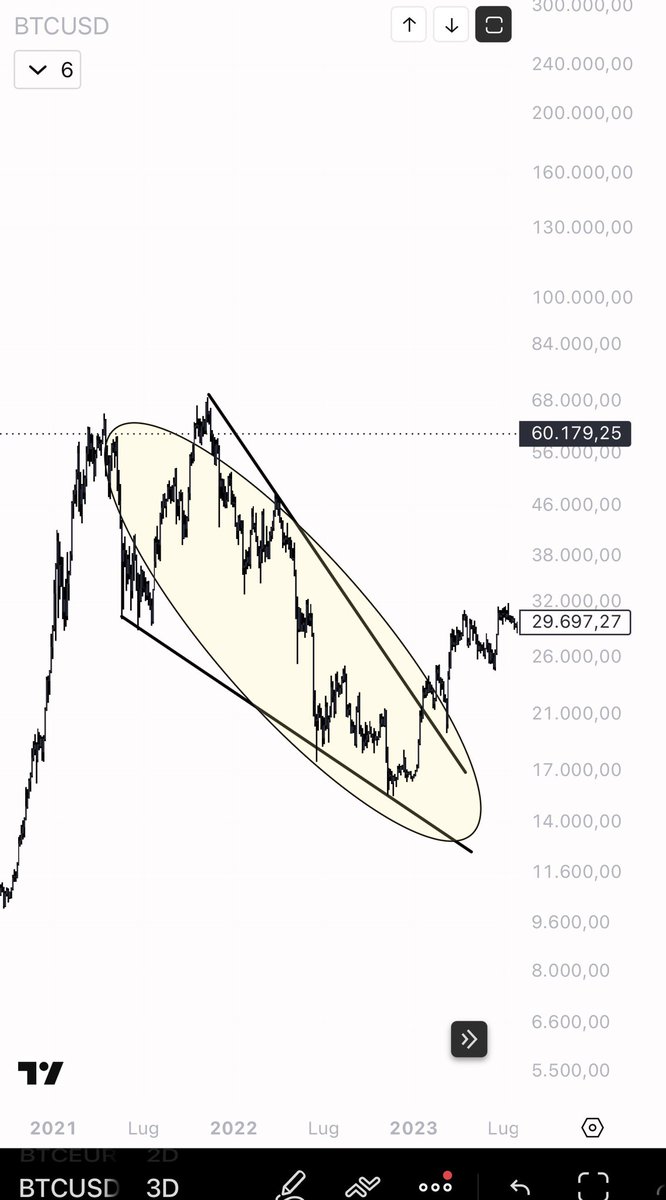

Max Favorable +5.2%Max Adverse −4.2%ACTIVE
EL
𝕏
Will $BTC reach new highs in the next 24 months? In my view, yes.
The longer this consolidation phase lasts, the more time the market has to absorb supply, reallocate positions and build a solid foundation for the next move.
In the short term, we are seeing constant inflows and outflows from ETFs, profit-taking by institutions and movements that often appear to be pure price manipulation. But these dynamics are part of the process of accumulating and redistributing liquidity.
Markets do not rise in a straight line. They need time to eliminate excess leverage, discourage the more emotional participants and transfer assets from the hands of the weak to those of the more patient.
Precisely for this reason, the longer this sideways phase lasts, the greater the energy accumulated for the subsequent expansion. It is a principle that has been repeated for decades across all financial markets: the longer the base, the more significant the subsequent movement may be.
No one can know the exact timing, but if demand continues to grow and supply remains limited, it would be no surprise at all to see Bitcoin reach new highs in the coming years.
Max Favorable +5.8%Max Adverse −9.2%ACTIVE
EL
𝕏
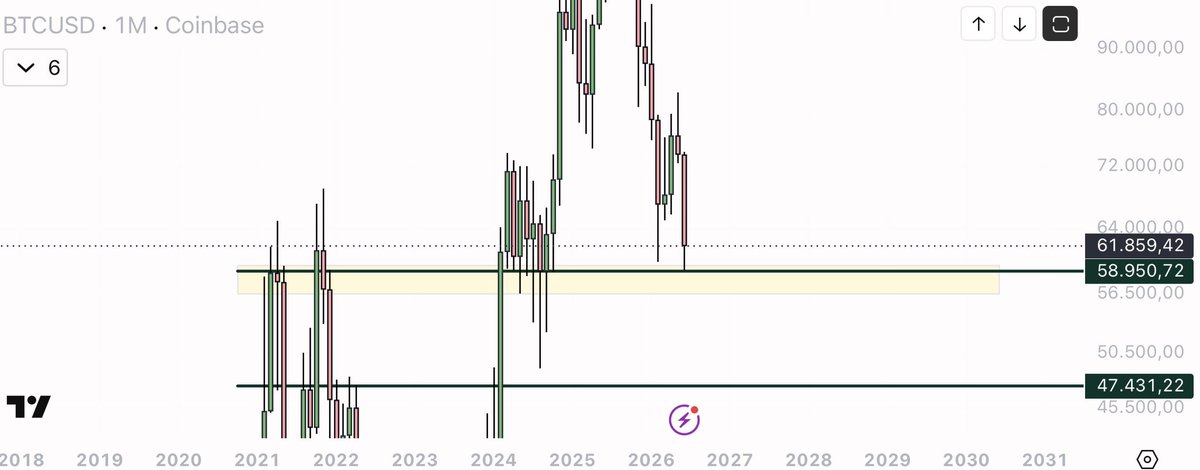
$BTC This level is not merely a support level: on the monthly chart, it represents a historical demand zone that has already held up on several occasions in the past. The same concept is also evident on the weekly chart, which is why I continue to regard it as one of the most important levels in the entire cycle.
As I indicated four days ago, it was reasonable to expect some rebounds, and indeed the market has already started to show them. As long as this area holds at the weekly close, the outlook remains positive in my view, and any weakness falls within the normal range of market volatility.
The situation would be different in the event of a clear break below the level on the weekly chart: at that point, the technical picture would become decidedly more bearish and the likelihood of a decline towards lower liquidity zones would increase.
Until then, however, I simply see a test of a massive support level. The market is deciding its next direction here.
PENDING TRIGGER
Scored Calls · Full Audit Trail
EL
𝕏
$TAO When it comes to TAO, I’m relatively unconcerned about short-term price movements. It may continue to consolidate, disrupt the price structure, or even treat us to a few significant dips.
What matters is that, in my view, it remains an extremely promising stock, with plenty of potential still to come. Sooner or later, TAO will enter another significant uptrend.
For this reason, I wouldn’t necessarily view any sharp drops as a negative, but rather as an opportunity to build positions with a very attractive risk/reward ratio, especially if the price continues to hold key support levels.
In the short term, we’re looking for the right timing. In the long term, we’re looking for the opportunity.

Max Favorable +0.7%Max Adverse −2.7%Opportunity 0.40Time 0.00Magnitude 0.40Score 0.16
EL
𝕏
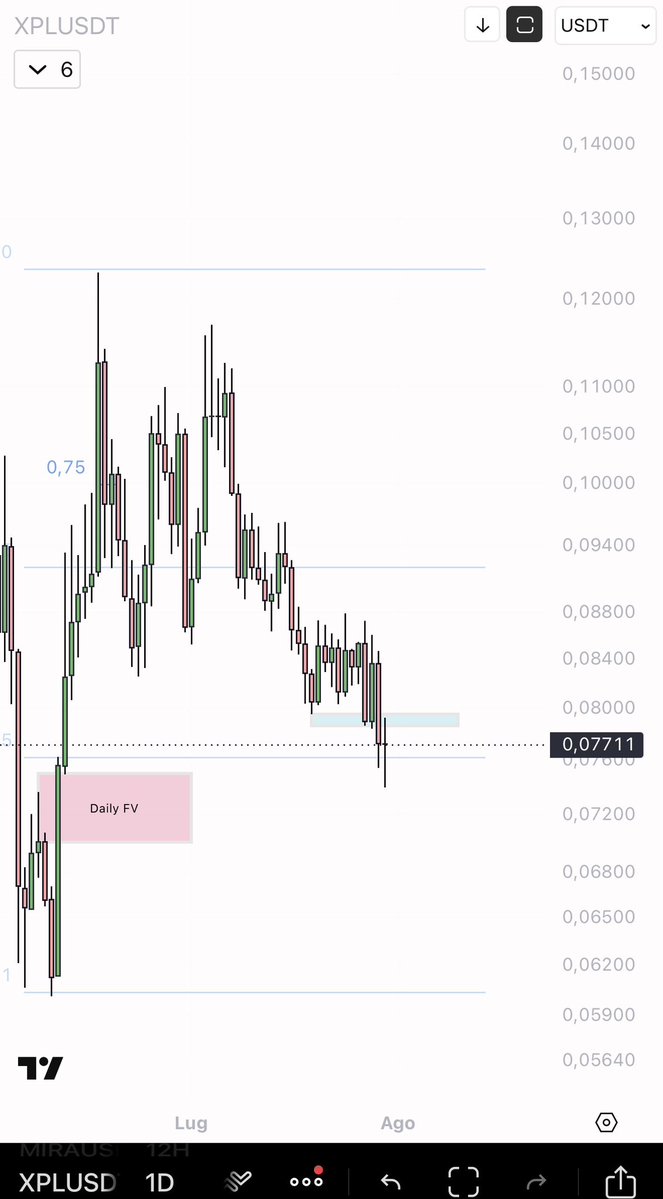
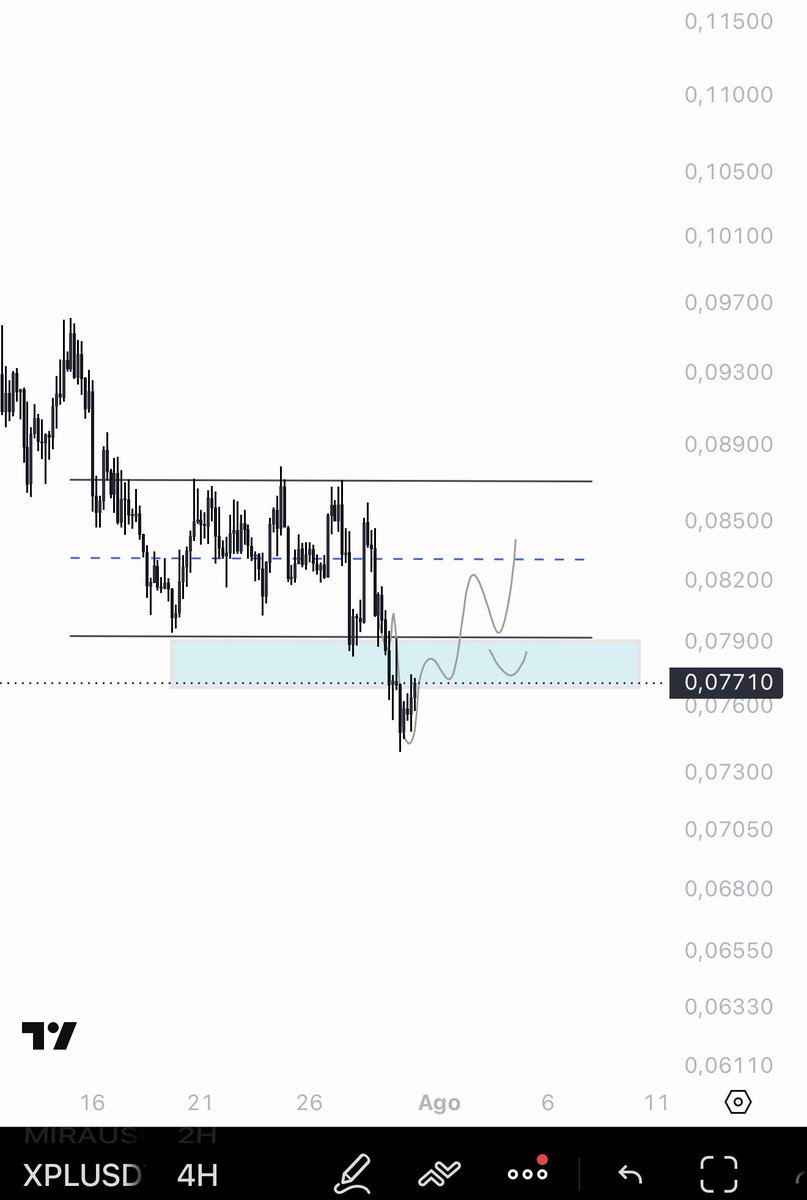
$XPL price into key support
Recovery range and good on low
Tmf https://t.co/IVepKOFEqI
Max Favorable +0.4%Max Adverse −2.1%Opportunity 0.13Time 0.00Magnitude 0.13Score 0.07
EL
𝕏
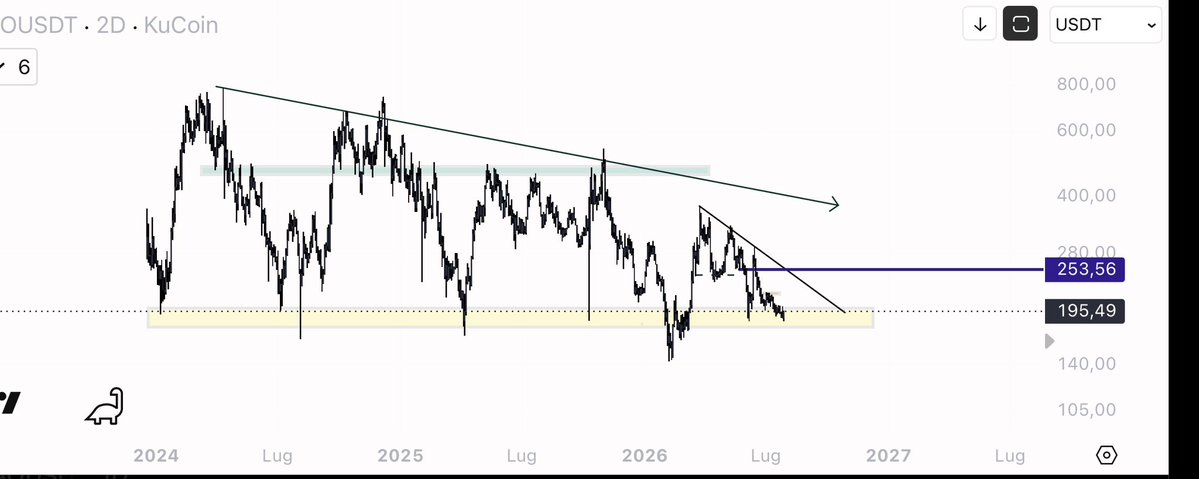
Retweet this to show others what it means to invest sensibly $TAO
I’m not the slightest bit worried about my spot position. As you know, I’m sticking with it and have no intention of changing my strategy until I have concrete reasons to do so.
For me, there’s no middle ground with this investment: I’ve allocated a portion of my portfolio that I’m prepared to see go down to zero, in exchange for the chance of a 10x–20x return.
That’s the difference between investing and trading.
In trading, you manage risk, stop-losses and timing. In investing, on the other hand, you accept volatility by following a long-term plan, without being swayed by short-term fluctuations.
If the project succeeds, the potential return will more than compensate for the risk taken. If, on the other hand, it fails, the loss was already factored in from day one. This is what it means to invest with discipline.
Max Favorable +2.2%Max Adverse −3.9%Opportunity 0.67Time 0.00Magnitude 0.67Score 0.28
EL
𝕏
hyperliquid:native
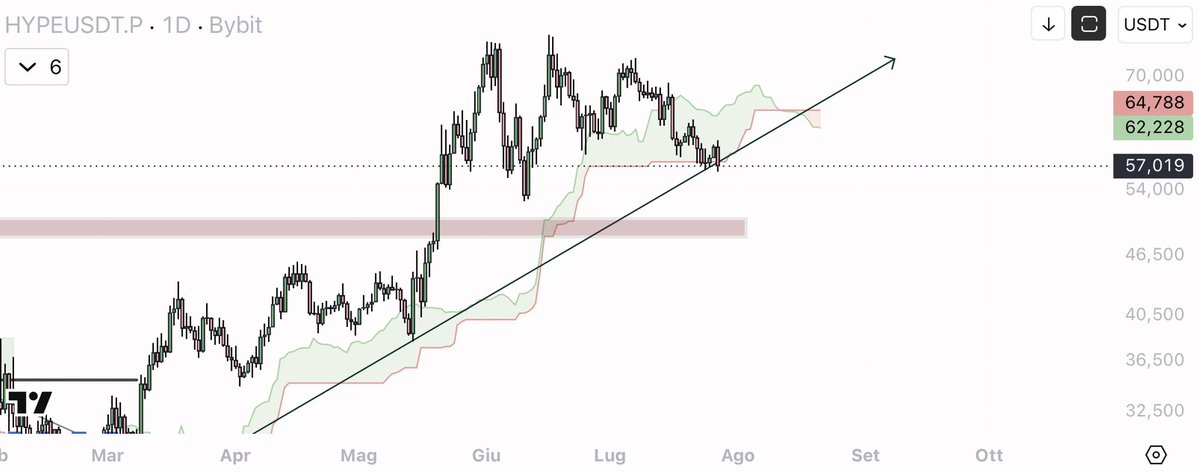
Here, the price is still supported by a very significant uptrend line, with the price hovering around 57. However, the reaction remains weak: there is still no real buying pressure, and the highs continue to be progressively lower.
For this reason, the trendline alone is not sufficient to consider the support reliable. If it were to be breached with a convincing daily close, the truly interesting zone would remain that between 50 and 47, where we also find a previous breakout level and a more solid horizontal structure.
Conversely, to improve the outlook, the price would first need to recover strongly to the 62/63 area. As long as the price remains below that range, the risk of a bearish break below the diagonal trendline remains high.
In summary: 57 is the immediate support level, but 50/47 remains the key area of greatest interest in the event of a breakdown.
Max Favorable +0.8%Max Adverse −0.6%Opportunity 0.35Time 0.00Magnitude 0.35Score 0.24
EL
𝕏
$LTC nice setup forming above box https://t.co/KlZnvzg8d4
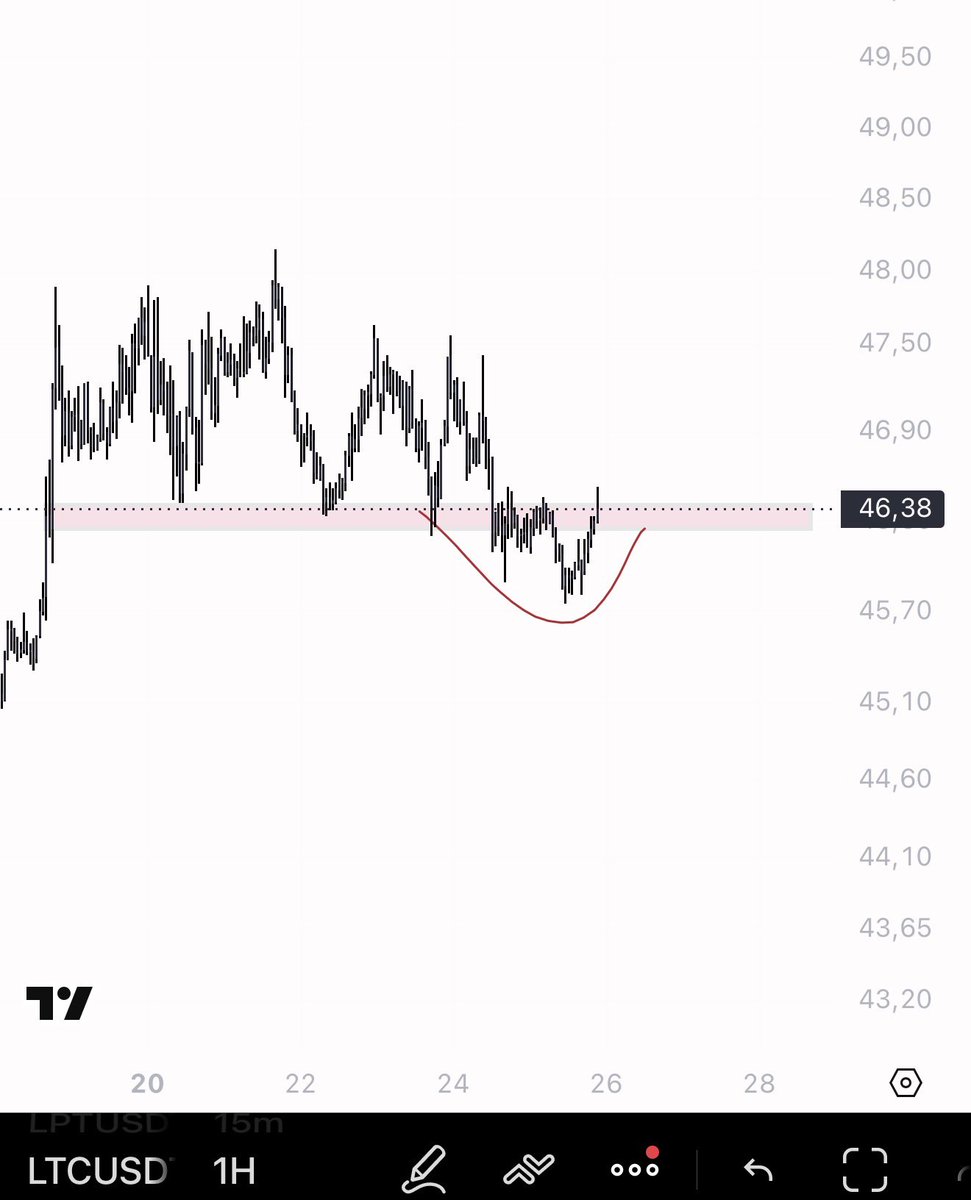
Max Favorable +3.8%Max Adverse −1.4%Opportunity 0.81Time 0.68Magnitude 0.81Score 0.68