@Cryptofaibik
“@Cryptofaibik posts 51.6% all-time accuracy across 518 calls, with a stronger 56.8% YTD, focusing on BTC, ETH, and select alts like TAO and ASTER with a heavily bullish lean. Their edge lies in Break/Pump setups, which dominate their call history and reflect a specialization in momentum entries over mid-term horizons.”
Score Breakdown
| CallRank Score | Move · Path · Time | Scored | |
|---|---|---|---|
| ALL-TIME | 52% | 0.67 · 0.46 · 0.39 | 545 |
| YTD | 55% | 0.73 · 0.51 · 0.40 | 180 |
| 30D | — | — | 0 |
CallRank Score by Duration
Short term52% 156 calls
Medium term52% 333 calls
Long term46% 56 calls
CallRank Score · Last 12 Months
Asset Breakdown — Top 5
| Asset | CallRank Score | Calls | 🟢 Bull · 🔴 Bear |
|---|---|---|---|
| BTC | 51% | 157 | 108 · 49 |
| ETH | 43% | 37 | 36 · 1 |
| ASTER | 50% | 22 | 22 · 0 |
| TAO | 52% | 21 | 21 · 0 |
| XRP | 67% | 12 | 12 · 0 |
Live Calls Summary · By Horizon
@Cryptofaibik's active forecasts grouped by horizon and asset. L = Long, S = Short, number = open call count.
Active assets for this forecaster:
| No assets selected | |
|---|---|
| ST | — |
| MT | — |
| LT | — |
ST = Short term · MT = Medium term · LT = Long term
Active Calls · 7 Live
CR
𝕏
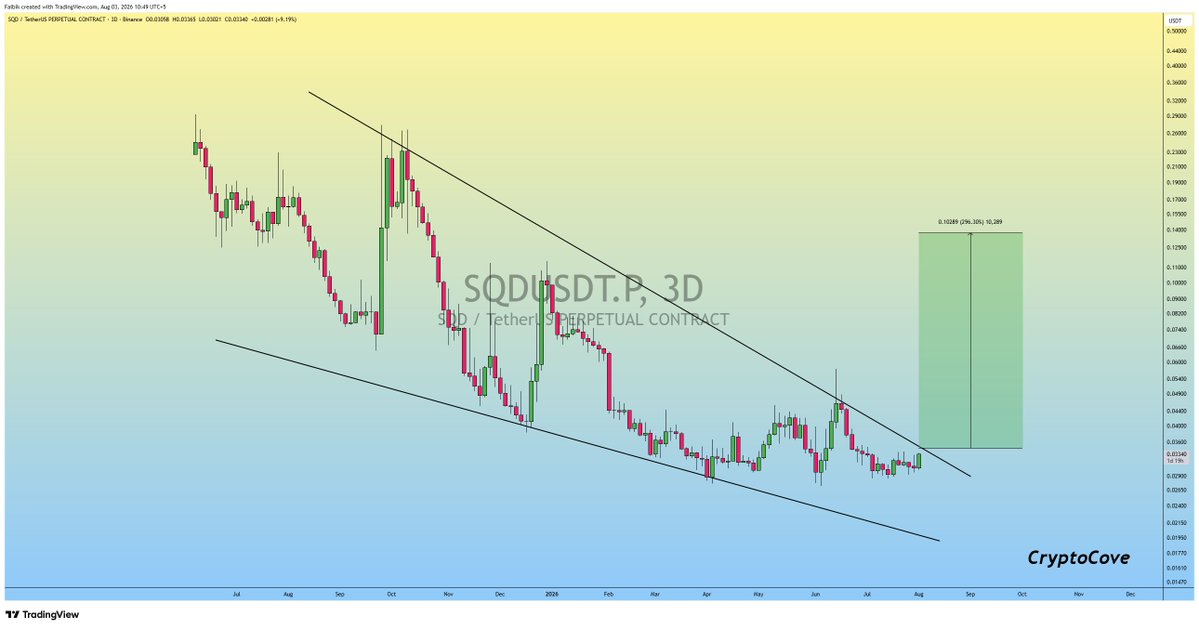
$SQD looks Promising for the Falling Wedge Breakout.. 🧐
Expecting +300% Bullish Rally so don't miss the RIDE..📈
#Crypto #SQD #SQDUSDT https://t.co/Mjp8VcCfYF
Max Favorable +3.5%Max Adverse −4.7%ACTIVE
CR
𝕏
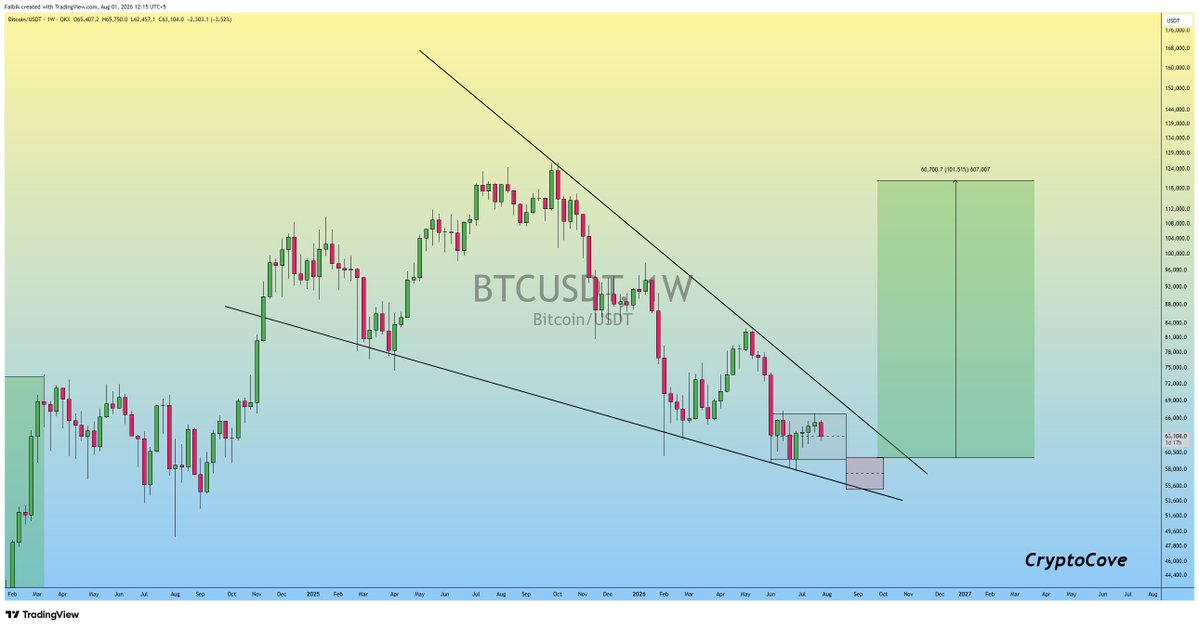
$BTC is currently following a market structure similar to the 2022–2023 PO3 cycle..📈
I expect Accumulation to continue until mid-August, followed by a possible manipulation phase through late August and September.
If this plays out, the next major Bullish rally could begin in Oct–Nov, with a long-term target of 125-130k by mid-2027..✍️
#Bitcoin #BTC #BTCUSDT
Max Favorable +0.1%Max Adverse −1.3%ACTIVE
CR
𝕏
$BTC #Bitcoin Expecting a Parabolic Move 🔜 https://t.co/szUzH4wjzP

Max Favorable +0.2%Max Adverse −0.1%ACTIVE
CR
𝕏
The last time #Bitcoin formed a Power of Three (PO3) pattern on the weekly timeframe, we witnessed a textbook market cycle.
Following a prolonged accumulation phase throughout 2022, $BTC completed a falling wedge breakout during Q1 2023 (January–February). Before that breakout, the market experienced a final manipulation phase in November–December 2022, where Bitcoin printed its cycle low and trapped late sellers.
What followed was one of the strongest bullish expansions of the cycle, with Bitcoin rallying approximately 280% over the following year.
Looking at the current market structure, the setup appears remarkably similar.
Bitcoin is once again trading within an accumulation phase. Based on the current price action and market structure, I expect this accumulation to continue until around mid-August.
After that, we could see a manipulation phase during late August and September, where the market may produce a final shakeout before establishing the cycle bottom. If this scenario plays out, September could present the best long-term buying opportunity.
Once the manipulation phase is complete, I expect the next major bullish expansion to begin in October–November, potentially marking the start of the next significant uptrend.
From a mid-term and long-term perspective, I remain bullish. If this cycle continues to follow the previous PO3 structure, I believe Bitcoin has the potential to reach the $125,000–$130,000 range by mid-2027.
I'll continue sharing updates and adjust the outlook whenever necessary..


Max Favorable +0.2%Max Adverse −0.0%ACTIVE
CR
𝕏
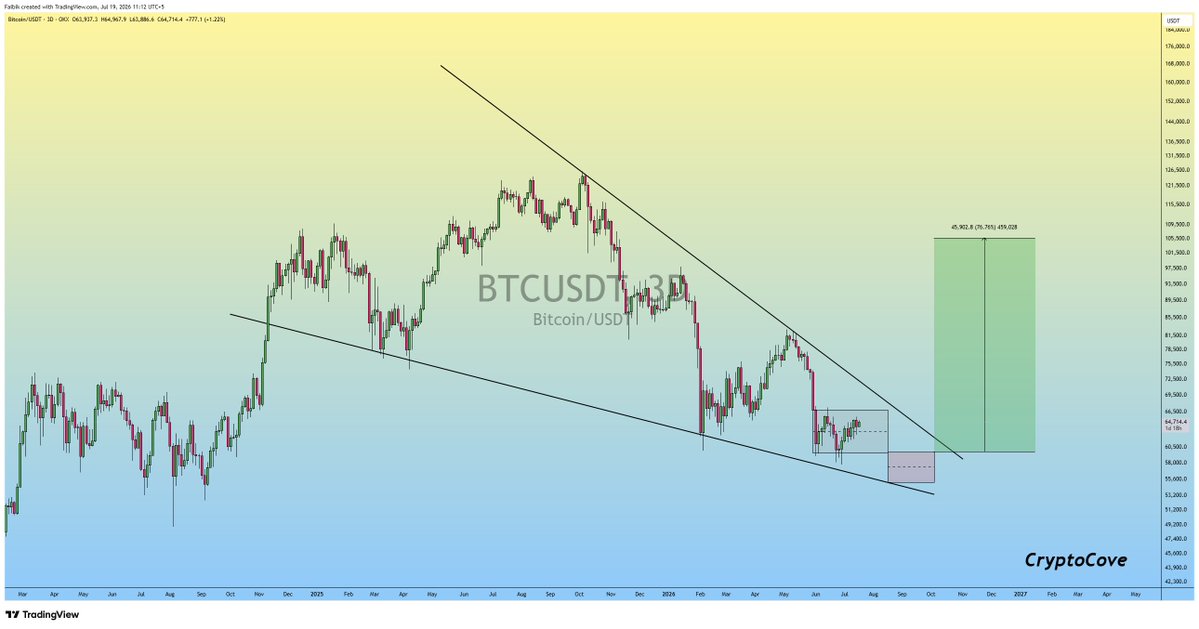
Over the past two months, $BTC has been trading in an accumulation phase, and I expect this phase to continue until around mid August. This is typically the period where smart money and institutional players quietly accumulate positions while the market remains relatively slow..
Following that, we could see a Manipulation phase from late August into mid September. During this period, #Bitcoin may make one final move lower to shake out weak hands before the next major rally. My current expectation is for a potential bottom in the $54,000–$55,000 range sometime in September.
If this scenario plays out, I anticipate a Bullish breakout around the beginning of October, potentially marking the start of the next strong uptrend. Throughout Q4, Bitcoin could deliver a 70–80% Bullish Rally. Based on this outlook, my target for January is $105,000.
For now, Bitcoin remains in the accumulation phase, and patience is essential. Historically, this is the stage where long-term positions are built. My approach is to continue accumulating strategically, and I'll provide regular updates as the market transitions into the expected manipulation phase..
In my view, the worst period for the bulls is behind us. Now it's time to stay Patient, stay Prepared & get Ready for what could be the next major bull season..
PENDING TRIGGER
Scored Calls · Full Audit Trail
CR
𝕏
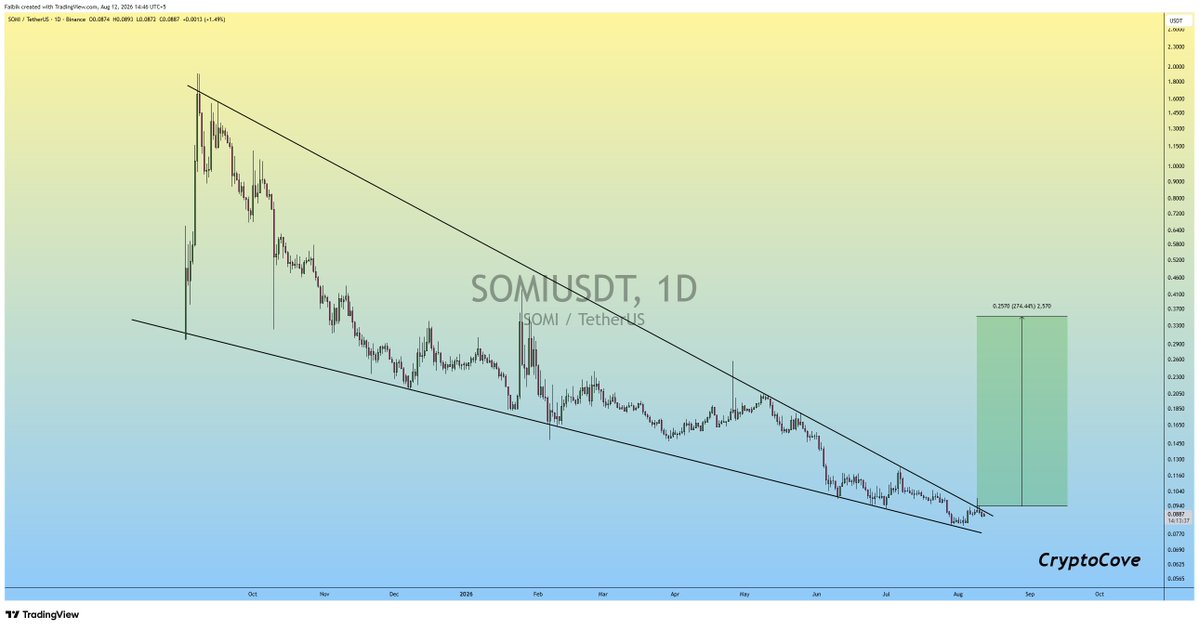
Adding Some $SOMI here..!!
Mega Pump incoming Soon..🔥📈
#Crypto #SOMI #SOMIUSDT https://t.co/LBD9QWgEmj
Max Favorable +9.8%Max Adverse −2.5%Opportunity 1.00Time 0.00Magnitude 1.00Score 0.55
CR
𝕏
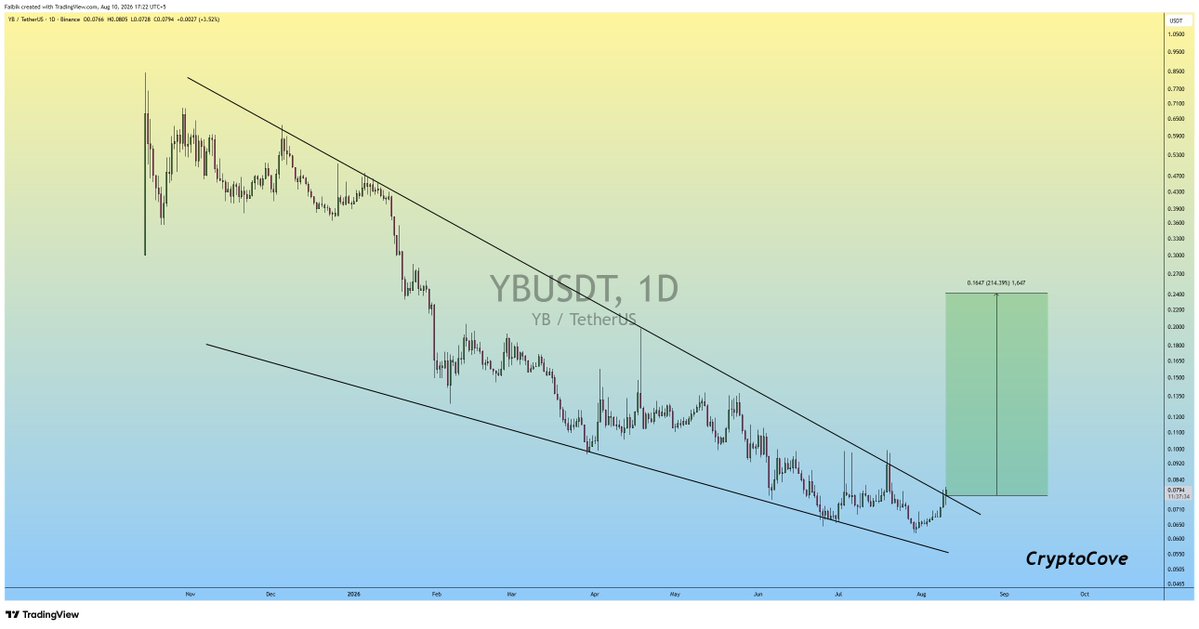
$YB is Breaking out of Falling Wedge Pattern..🚀
Expecting +200% Bullish Rally..🔥📈
#Crypto #YB #YBUSDT https://t.co/66aSAV7K09
Max Favorable +1.7%Max Adverse −4.2%Opportunity 0.50Time 0.00Magnitude 0.50Score 0.22
CR
𝕏
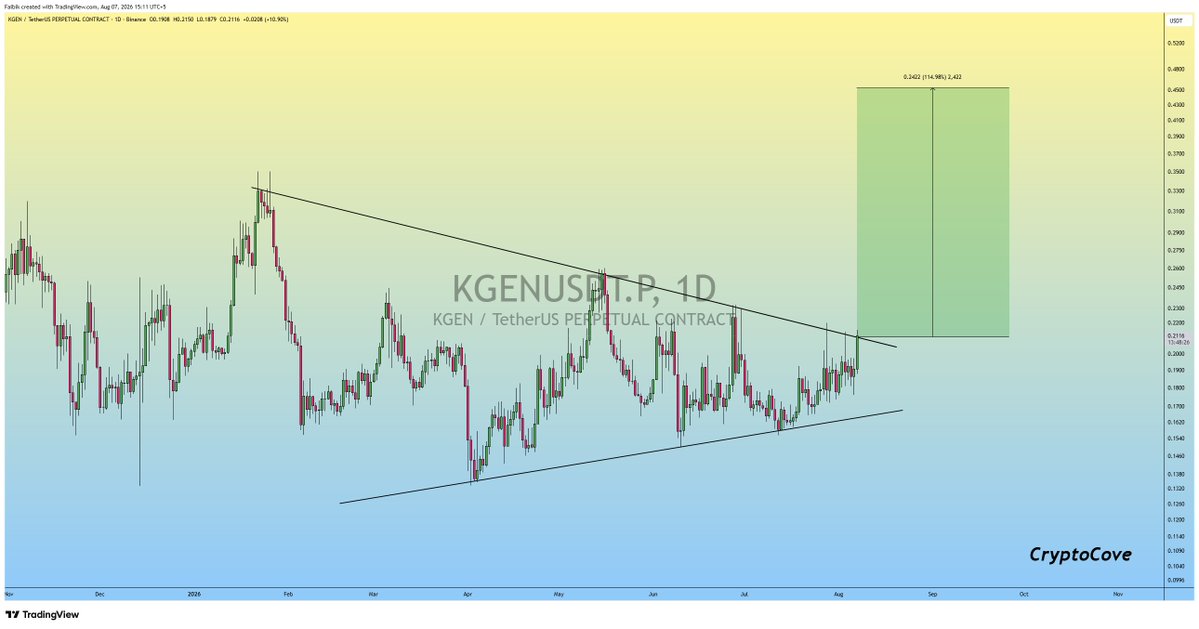
$KGEN is Getting Ready for the Bullish Rally..📈 https://t.co/V56rceCgFM
Max Favorable +17.1%Max Adverse −13.8%Opportunity 0.99Time 0.00Magnitude 0.99Score 0.55
CR
𝕏
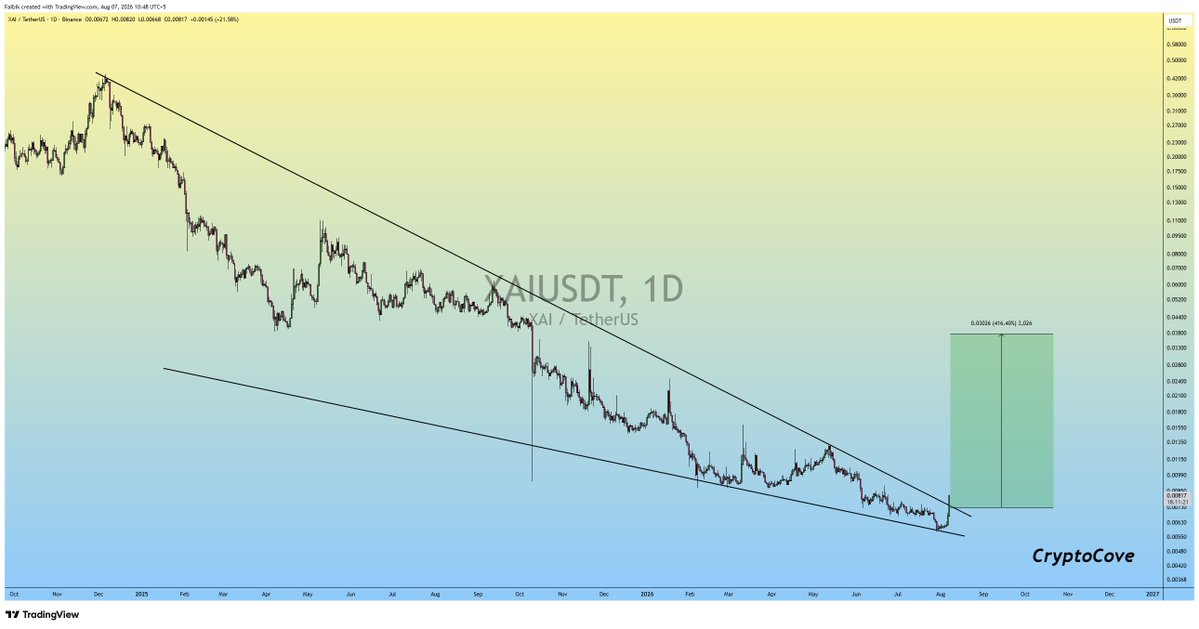
$XAI is Breaking out of Falling Wedge on the Daily timeframe Chart..!!
Expecting Massive Bullish Rally so Don't miss the RIDE.. 📈
#Crypto #XAI #XAIUSDT https://t.co/kAXDNFySno
Max Favorable +7.9%Max Adverse −19.9%Opportunity 0.99Time 0.00Magnitude 0.99Score 0.40
CR
𝕏
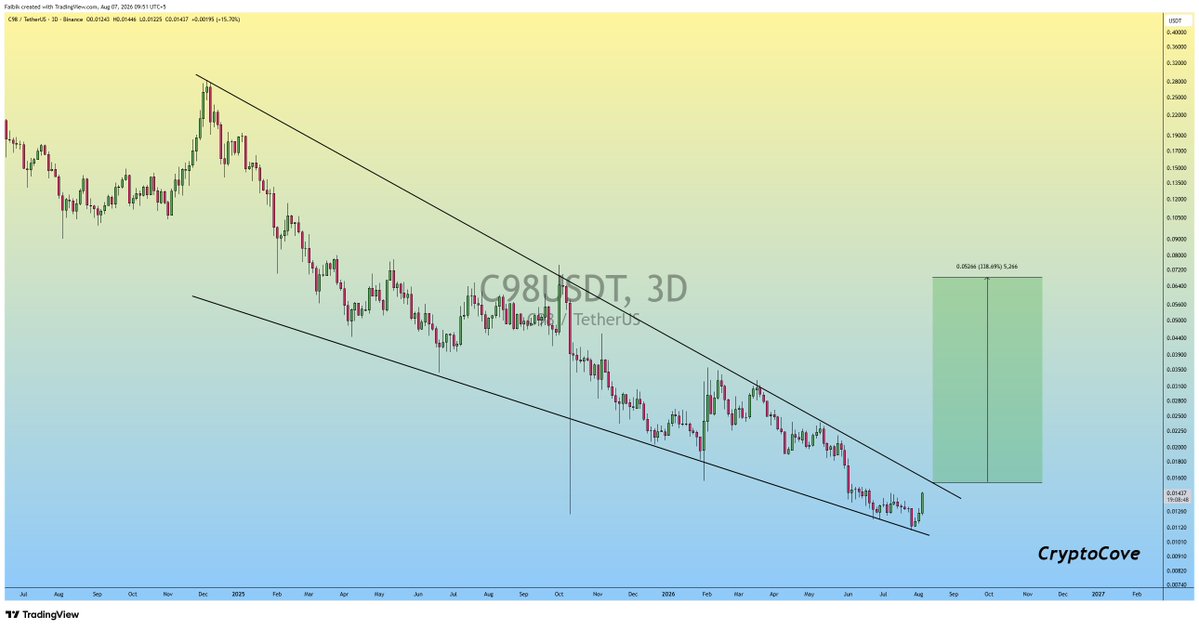
$C98 is Quietly setting the stage for a massive Move.. 🚀
Keep it on your Radar..🧐
#Crypto #C98 #C98USDT https://t.co/IMIyyHov93
Max Favorable +28.1%Max Adverse −2.4%Opportunity 1.00Time 1.00Magnitude 1.00Score 0.91